Dataset · 2022 to 2025 · computed from raw Backblaze files
Backblaze hard drive AFR by capacity group, 2022 to 2025
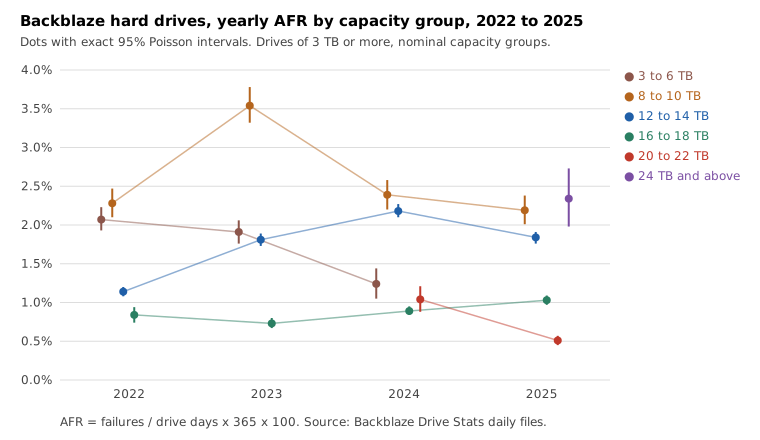
Yearly annualized failure rate of Backblaze's hard drives by nominal capacity group, computed from the raw daily Drive Stats files for 2022 to 2025 (sixteen quarterly zips) with the drive-day exposure of each group and exact 95% Poisson intervals. Sample: drives of 3 TB or more, 388,670,883 drive days and 16,051 failures over the four years. In 2025 the 20 to 22 TB group was at 0.51% on 16.0% of drive days, 16 to 18 TB at 1.03%, 12 to 14 TB at 1.84% and 8 to 10 TB at 2.19%. One fleet, and capacity groups mix models and ages, so the file does not show an effect of size.
Download CSV25 rows · 8 columns · CSVPopulation and method
Population: hard drives of 3 TB or more in Backblaze’s own data centers, from the daily Drive Stats files for January 1, 2022 to December 31, 2025 (sixteen quarterly zips, 1,461 daily files). That is 388,670,883 drive days and 16,051 failures. Each daily row is one drive day and a row with failure = 1 is a failure.
A drive goes into a group by its nominal capacity, round(capacity_bytes ÷ 1e12) terabytes: 3 to 6, 8 to 10, 12 to 14, 16 to 18, 20 to 22, and 24 and above. AFR is failures ÷ drive days × 365 × 100, with 365 used for 2024 too. The interval is the exact two-sided 95% Poisson interval. The build checks that the groups add up to the All row of each year. The chart shows only groups with at least 1% of a year’s drive days. The CSV keeps every row, including thin ones with very wide intervals.
Cross-check: Backblaze’s annual reports give 1.70% for 2023 and 1.36% for 2025, and the All rows here give the same two numbers. The 2022 and 2024 figures (1.39% and 1.59%) are close to but not the same as the published ones, because Backblaze removes boot drives and drives that miss its annual criteria and this file keeps every row of 3 TB or more.
Chart
Counted here
- Pooled AFR was 1.39% in 2022, 1.70% in 2023, 1.59% in 2024 and 1.36% in 2025.
- In 2025 the 20 to 22 TB group was at 0.51% (0.45% to 0.57%) on 16.0% of drive days, 16 to 18 TB at 1.03% on 36.3%, 12 to 14 TB at 1.84% on 37.5%, and 8 to 10 TB at 2.19% on 7.8%.
- The 12 to 14 TB group went from 1.14% in 2022 to 2.18% in 2024 and 1.84% in 2025, while its share of drive days fell from 55.3% to 37.5%.
- The 24 TB and above group appears in 2024 with 16,820 drive days and in 2025 with 2,406,787 drive days, 154 failures and 2.34% (1.98% to 2.73%). It first appears in 2024.
Limits
- Association only, one fleet. A capacity group is a set of models of different ages, makers and batches, so a gap between groups is not an effect of size, and one model can set a group’s rate.
- Groups gain and lose drive days over the four years as Backblaze buys and retires models, so the same group in two years is not the same drives.
- Thin rows, such as 24 TB and above in 2024 and 3 to 6 TB in 2025, have intervals too wide to read. Backblaze retires drives for reasons other than failure, which this file cannot see.
- Intervals assume failures are Poisson in drive days with a constant rate inside each year, which ignores clustering. They are probably too narrow.
Table
| Year | Capacity group | Drive days | Share (%) | Failures | AFR (%) | 95% low | 95% high |
|---|---|---|---|---|---|---|---|
| 2022 | All | 78,872,637 | 100.0 | 2993 | 1.39 | 1.34 | 1.44 |
| 2022 | 3 to 6 TB | 13,071,125 | 16.6 | 742 | 2.07 | 1.93 | 2.23 |
| 2022 | 8 to 10 TB | 9,657,076 | 12.2 | 603 | 2.28 | 2.10 | 2.47 |
| 2022 | 12 to 14 TB | 43,610,844 | 55.3 | 1361 | 1.14 | 1.08 | 1.20 |
| 2022 | 16 to 18 TB | 12,533,592 | 15.9 | 287 | 0.84 | 0.74 | 0.94 |
| 2023 | All | 90,053,807 | 100.0 | 4200 | 1.70 | 1.65 | 1.75 |
| 2023 | 3 to 6 TB | 11,956,527 | 13.3 | 625 | 1.91 | 1.76 | 2.06 |
| 2023 | 8 to 10 TB | 9,503,153 | 10.6 | 922 | 3.54 | 3.32 | 3.78 |
| 2023 | 12 to 14 TB | 43,430,541 | 48.2 | 2151 | 1.81 | 1.73 | 1.89 |
| 2023 | 16 to 18 TB | 25,040,729 | 27.8 | 500 | 0.73 | 0.67 | 0.80 |
| 2023 | 20 to 22 TB | 122,857 | 0.1 | 2 | 0.59 | 0.07 | 2.15 |
| 2024 | All | 103,807,655 | 100.0 | 4531 | 1.59 | 1.55 | 1.64 |
| 2024 | 3 to 6 TB | 4,757,333 | 4.6 | 161 | 1.24 | 1.05 | 1.44 |
| 2024 | 8 to 10 TB | 9,340,506 | 9.0 | 611 | 2.39 | 2.20 | 2.58 |
| 2024 | 12 to 14 TB | 43,762,257 | 42.2 | 2615 | 2.18 | 2.10 | 2.27 |
| 2024 | 16 to 18 TB | 40,571,115 | 39.1 | 992 | 0.89 | 0.84 | 0.95 |
| 2024 | 20 to 22 TB | 5,359,624 | 5.2 | 152 | 1.04 | 0.88 | 1.21 |
| 2024 | 24 TB and above | 16,820 | 0.0 | 0 | 0.00 | 0.00 | 8.01 |
| 2025 | All | 115,936,784 | 100.0 | 4327 | 1.36 | 1.32 | 1.40 |
| 2025 | 3 to 6 TB | 401,235 | 0.3 | 5 | 0.45 | 0.15 | 1.06 |
| 2025 | 8 to 10 TB | 9,075,706 | 7.8 | 544 | 2.19 | 2.01 | 2.38 |
| 2025 | 12 to 14 TB | 43,432,981 | 37.5 | 2184 | 1.84 | 1.76 | 1.91 |
| 2025 | 16 to 18 TB | 42,097,817 | 36.3 | 1183 | 1.03 | 0.97 | 1.09 |
| 2025 | 20 to 22 TB | 18,522,258 | 16.0 | 257 | 0.51 | 0.45 | 0.57 |
| 2025 | 24 TB and above | 2,406,787 | 2.1 | 154 | 2.34 | 1.98 | 2.73 |
Columns
- year
- Calendar year, 2022 to 2025 (all four quarterly files of the year).
- capacity_group
- All hard drives of 3 TB or more, or a nominal capacity group from round(capacity_bytes / 1e12): 3 to 6 TB, 8 to 10 TB, 12 to 14 TB, 16 to 18 TB, 20 to 22 TB, 24 TB and above. A group with no drive days in a year has no row.
- drive_days
- Daily rows (drive days) of the group in the year. This is the exposure.
- share_of_year_drive_days_percent
- The group share of the All drive days in that year, one decimal.
- failures
- Rows with failure = 1 in the year.
- afr_percent
- failures / drive_days * 365 * 100, two decimals. Computed here, with 365 days in every year.
- afr_low95
- Lower bound of the exact two-sided 95% Poisson (Garwood) interval, in percent.
- afr_high95
- Upper bound of the same interval, in percent.
License
Derivative table computed from the Backblaze Drive Stats daily files for 2022 to 2025. Cite Backblaze if you use it. You are solely responsible for how you use it. Backblaze's dataset page allows sale of derivative works and forbids selling the Drive Stats data itself. This CSV is a 25-row aggregate, not the daily SMART archive, and that archive is not for sale.
Backblaze Drive Stats use terms · Hard Drive Test Data page
Sources
- Backblaze Hard Drive Test Data, data_Q1_2022.zip (daily CSV files)
- Backblaze Hard Drive Test Data, data_Q2_2022.zip (daily CSV files)
- Backblaze Hard Drive Test Data, data_Q3_2022.zip (daily CSV files)
- Backblaze Hard Drive Test Data, data_Q4_2022.zip (daily CSV files)
- Backblaze Hard Drive Test Data, data_Q1_2023.zip (daily CSV files)
- Backblaze Hard Drive Test Data, data_Q2_2023.zip (daily CSV files)
- Backblaze Hard Drive Test Data, data_Q3_2023.zip (daily CSV files)
- Backblaze Hard Drive Test Data, data_Q4_2023.zip (daily CSV files)
- Backblaze Hard Drive Test Data, data_Q1_2024.zip (daily CSV files)
- Backblaze Hard Drive Test Data, data_Q2_2024.zip (daily CSV files)
- Backblaze Hard Drive Test Data, data_Q3_2024.zip (daily CSV files)
- Backblaze Hard Drive Test Data, data_Q4_2024.zip (daily CSV files)
- Backblaze Hard Drive Test Data, data_Q1_2025.zip (daily CSV files)
- Backblaze Hard Drive Test Data, data_Q2_2025.zip (daily CSV files)
- Backblaze Hard Drive Test Data, data_Q3_2025.zip (daily CSV files)
- Backblaze Hard Drive Test Data, data_Q4_2025.zip (daily CSV files)
- Backblaze Hard Drive Test Data page and use terms
- Backblaze Drive Stats for 2025 (published annual table: 115,638,676 drive days, 4,317 failures, 1.36%)
- Garwood, F. (1936). Fiducial limits for the Poisson distribution. Biometrika 28(3-4), 437-442