Dataset · 2025 · computed from raw Backblaze files
Backblaze SSD models in 2025: drive days, failures and the AFR upper bound
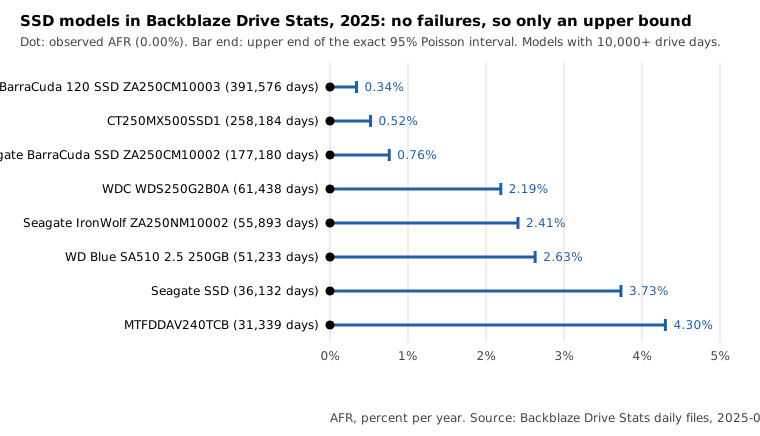
Exposure and failures for the SSD models in Backblaze's raw Drive Stats files for 2025 (January 1 to December 31, 2025). Sample: 20 SSD models, 1,075,258 drive days, 2,972 drives on December 31, and zero failures. With no failures the file gives each model's exact 95% upper bound on the annualized failure rate: 0.13% for all SSD models pooled, and 0.34% to 4.30% for the models with 10,000 or more drive days. One fleet, mostly boot drives, so it does not describe SSDs in general.
Download CSV21 rows · 12 columns · CSVPopulation and method
Population: every SSD model in Backblaze’s own data centers that appears in the daily Drive Stats files from January 1 to December 31, 2025 (four quarterly zips). Models were picked by name patterns, which are listed in the step 1 script. The Dell BOSS virtual disk is left out because it is a RAID volume, not a drive. That leaves 20 models, 1,075,258 drive days and 2,972 drives with a power-on value on December 31, 2025.
Each daily row is one drive day and a row with failure = 1 is a failure. No SSD row has failure = 1 in 2025, so every AFR in the file is 0.00%. With zero failures the useful number is how high the true rate could be. The file gives the upper end of the exact two-sided 95% Poisson interval, −ln(0.025) ÷ (drive days ÷ 365) × 100, which is the same one-sided rule as “about 3.7 events” divided by exposure. The build checks every bound against its drive days.
Chart
Counted here
- 1,075,258 SSD drive days and 0 failures. The pooled upper bound is 0.13%.
- 8 models have 10,000 or more drive days. Their upper bounds run from 0.34% to 4.30%. The largest is Seagate BarraCuda 120 SSD ZA250CM10003 with 391,576 drive days (36.4% of the total) and an upper bound of 0.34%.
- The other 12 models have between 256 and 4,011 drive days, so their upper bounds are far above any plausible rate and say almost nothing.
Limits
- Zero failures is a count in one fleet, not a claim that SSDs do not fail. These are mostly small boot drives with a light, steady workload, not data drives, and they are a few thousand units.
- The upper bound is a statistical limit on the rate given the exposure. It assumes failures are Poisson in drive days with a constant rate and ignores clustering and age, so it is probably too narrow.
- Backblaze retires drives for reasons other than failure, and a drive that is removed and not marked failed adds no failure here. The file cannot see that.
- SSD models were chosen by name pattern. A model whose name matches none of the patterns would be missing, and a pooled row mixes very different products.
- Median age uses power-on hours as reported, with no check for resets. Drive counts are drives with a power-on value on one day.
Table
| Model | GB | Q1 days | Q2 days | Q3 days | Q4 days | Drive days | Drives Dec 31 | Median age (years) | Failures | AFR (%) | 95% high |
|---|---|---|---|---|---|---|---|---|---|---|---|
| CT250MX500SSD1 | 250 | 63,204 | 63,750 | 65,349 | 65,881 | 258,184 | 713 | 3.18 | 0 | 0.00 | 0.52 |
| MTFDDAV240TCB | 240 | 7,740 | 7,790 | 7,900 | 7,909 | 31,339 | 86 | 5.11 | 0 | 0.00 | 4.30 |
| MTFDDAV480TCB | 480 | 180 | 180 | 184 | 184 | 728 | 2 | 3.06 | 0 | 0.00 | 184.95 |
| Micron 5300 MTFDDAK480TDS | 480 | 270 | 273 | 276 | 276 | 1,095 | 3 | 2.63 | 0 | 0.00 | 122.96 |
| SSDSCKKB240GZR | 240 | 90 | 91 | 92 | 92 | 365 | 1 | 2.87 | 0 | 0.00 | 368.89 |
| SSDSCKKB480G8R | 480 | 4 | 91 | 92 | 92 | 279 | 1 | 0.76 | 0 | 0.00 | 482.60 |
| Samsung SSD 850 EVO 1TB | 1000 | 90 | 163 | 184 | 184 | 621 | 2 | 1.09 | 0 | 0.00 | 216.82 |
| Samsung SSD 850 PRO 1TB | 1024 | 24 | 91 | 92 | 92 | 299 | 1 | 0.96 | 0 | 0.00 | 450.31 |
| Samsung SSD 860 PRO 2TB | 2048 | 90 | 162 | 184 | 184 | 620 | 2 | 3.02 | 0 | 0.00 | 217.17 |
| Samsung SSD 870 EVO 2TB | 2000 | 0 | 72 | 92 | 92 | 256 | 1 | 0.70 | 0 | 0.00 | 525.95 |
| Seagate BarraCuda 120 SSD ZA250CM10003 | 250 | 97,408 | 97,089 | 98,520 | 98,559 | 391,576 | 1073 | 4.85 | 0 | 0.00 | 0.34 |
| Seagate BarraCuda 120 SSD ZA500CM10003 | 500 | 270 | 273 | 276 | 276 | 1,095 | 3 | 3.62 | 0 | 0.00 | 122.96 |
| Seagate BarraCuda SSD ZA2000CM10002 | 2000 | 180 | 182 | 183 | 184 | 729 | 2 | 6.62 | 0 | 0.00 | 184.70 |
| Seagate BarraCuda SSD ZA250CM10002 | 250 | 44,070 | 44,077 | 44,535 | 44,498 | 177,180 | 484 | 5.84 | 0 | 0.00 | 0.76 |
| Seagate BarraCuda SSD ZA500CM10002 | 500 | 986 | 1,001 | 1,012 | 1,012 | 4,011 | 11 | 7.04 | 0 | 0.00 | 33.57 |
| Seagate FireCuda 120 SSD ZA500GM10001 | 500 | 540 | 541 | 552 | 552 | 2,185 | 6 | 2.35 | 0 | 0.00 | 61.62 |
| Seagate IronWolf ZA250NM10002 | 250 | 12,744 | 13,411 | 14,461 | 15,277 | 55,893 | 173 | 2.47 | 0 | 0.00 | 2.41 |
| Seagate SSD | 250 | 8,996 | 8,932 | 9,105 | 9,099 | 36,132 | 99 | 6.34 | 0 | 0.00 | 3.73 |
| WD Blue SA510 2.5 250GB | 250 | 11,874 | 12,797 | 13,323 | 13,239 | 51,233 | 143 | 0.08 | 0 | 0.00 | 2.63 |
| WDC WDS250G2B0A | 250 | 15,597 | 15,170 | 15,364 | 15,307 | 61,438 | 166 | 2.92 | 0 | 0.00 | 2.19 |
| ALL SSD models | 264,357 | 266,136 | 271,776 | 272,989 | 1,075,258 | 2972 | 4.45 | 0 | 0.00 | 0.13 |
Columns
- model
- Model string exactly as in the Backblaze daily files. SSD models were picked by name patterns listed in the step 1 script. The Dell BOSS virtual disk is not included.
- capacity_gb
- Nominal capacity in gigabytes (capacity_bytes / 1e9, rounded). Empty on the pooled row.
- drive_days_q1
- Daily rows of the model from 2025-01-01 to 2025-03-31.
- drive_days_q2
- Daily rows from 2025-04-01 to 2025-06-30.
- drive_days_q3
- Daily rows from 2025-07-01 to 2025-09-30.
- drive_days_q4
- Daily rows from 2025-10-01 to 2025-12-31.
- drive_days
- Sum of the four quarters. This is the exposure.
- drives_2025_12_31
- Drives in the 2025-12-31 file that have a power-on-hours value.
- median_age_years_2025_12_31
- Median smart_9_raw of those drives divided by 8766, two decimals. Power-on hours as reported.
- failures
- Rows with failure = 1 in 2025. Zero for every model.
- afr_percent
- failures / drive_days * 365 * 100, two decimals. Computed here.
- afr_high95
- Upper end of the exact two-sided 95% Poisson interval for zero failures, -ln(0.025) / (drive_days / 365) * 100, two decimals. The lower end is 0.
License
Derivative table computed from the Backblaze Drive Stats daily files for 2025. Cite Backblaze if you use it. You are solely responsible for how you use it. Backblaze's dataset page allows sale of derivative works and forbids selling the Drive Stats data itself. This CSV is a 21-row aggregate, not the daily SMART archive, and that archive is not for sale.
Backblaze Drive Stats use terms · Hard Drive Test Data page
Sources
- Backblaze Hard Drive Test Data, data_Q1_2025.zip (daily CSV files)
- Backblaze Hard Drive Test Data, data_Q2_2025.zip (daily CSV files)
- Backblaze Hard Drive Test Data, data_Q3_2025.zip (daily CSV files)
- Backblaze Hard Drive Test Data, data_Q4_2025.zip (daily CSV files)
- Backblaze Hard Drive Test Data page and use terms