Dataset · 2025 · computed from raw Backblaze files
Backblaze hard drive AFR by month and capacity class, 2025
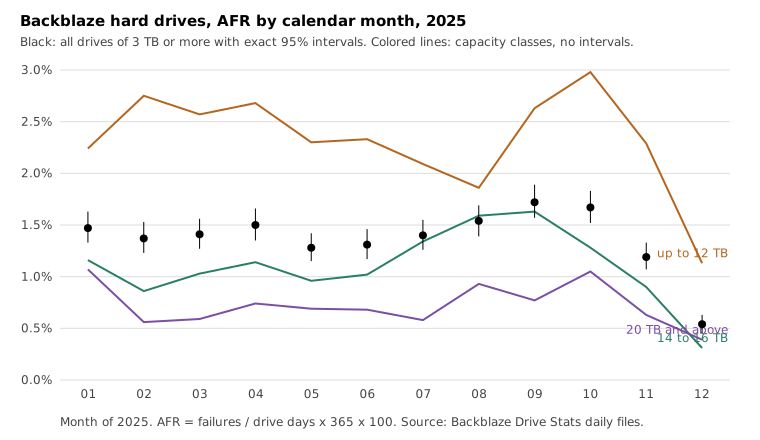
Month-by-month annualized failure rate of Backblaze's hard drives in 2025 (January 1 to December 31), computed from the raw daily Drive Stats files with exact 95% Poisson intervals, for all drives of 3 TB or more and for three capacity classes. Sample: 115,936,784 drive days and 4,327 failures, a 1.36% pooled AFR that matches Backblaze's published annual figure. Monthly AFR runs from 0.54% in December to 1.72% in September. One fleet, one year, and the file does not say why months differ.
Download CSV52 rows · 7 columns · CSVPopulation and method
Population: hard drives of 3 TB or more in Backblaze’s own data centers, from the daily Drive Stats files for January 1 to December 31, 2025 (four quarterly zips). That is 115,936,784 drive days and 4,327 failures, a pooled AFR of 1.36% (1.32% to 1.40%). Each daily row is one drive day and a row with failure = 1 is a failure. The month comes from the date of the file.
AFR is failures ÷ drive days × 365 × 100 for every month, so short months are not rescaled. The interval is the exact two-sided 95% Poisson interval on the failure count. Capacity classes use nominal terabytes: up to 12 TB, 14 to 16 TB, and 20 TB and above. The build checks that the months add up to the 2025 rows and the classes add up to the All rows.
Cross-check: Backblaze’s own 2025 annual table has 115,638,676 drive days, 4,317 failures and 1.36%. This file has 115,936,784 drive days and 4327 failures, also 1.36%. The small gap is expected to come from the selection rules: Backblaze says it removes boot drives and drives that do not meet its annual criteria, while this file keeps every row of 3 TB or more. The Q4 months here add up to 945 failures, the same count as the SMART dataset from the same files.
Chart
Counted here
- For all drives the lowest month is 2025-12 at 0.54% (0.45% to 0.63%, 152 failures) and the highest is 2025-09 at 1.72% (1.57% to 1.89%, 457 failures).
- The rate was 1.72% in September, 1.67% in October, 1.19% in November and 0.54% in December. The December interval (0.45% to 0.63%) does not overlap November’s (1.07% to 1.33%).
- Over the whole year the classes differ: up to 12 TB is 2.32%, 14 to 16 TB is 1.10% and 20 TB and above is 0.72%. The 20 TB and above class grew from 1,154,815 drive days in January to 2,338,412 in December.
Limits
- Association only, one fleet, one year. The file shows how the rate moved from month to month. It does not say why, and it cannot tell a real change from a change in which drives were in use or how failures were recorded.
- The low December figure is a count in these files. This file does not explain it, and later data would show whether it held.
- Capacity classes mix models of different ages, so the class gap is not an effect of size alone.
- Intervals assume failures are Poisson in drive days with a constant rate inside each month, which ignores clustering. They are probably too narrow.
- Each month is its own estimate, with no adjustment for looking at twelve of them.
Table
| Month | Class | Drive days | Failures | AFR (%) | 95% low | 95% high |
|---|---|---|---|---|---|---|
| 2025-01 | All | 9,332,637 | 377 | 1.47 | 1.33 | 1.63 |
| 2025-02 | All | 8,550,097 | 322 | 1.37 | 1.23 | 1.53 |
| 2025-03 | All | 9,552,945 | 368 | 1.41 | 1.27 | 1.56 |
| 2025-04 | All | 9,309,229 | 382 | 1.50 | 1.35 | 1.66 |
| 2025-05 | All | 9,638,285 | 338 | 1.28 | 1.15 | 1.42 |
| 2025-06 | All | 9,499,417 | 341 | 1.31 | 1.17 | 1.46 |
| 2025-07 | All | 9,869,301 | 379 | 1.40 | 1.26 | 1.55 |
| 2025-08 | All | 9,920,423 | 418 | 1.54 | 1.39 | 1.69 |
| 2025-09 | All | 9,688,673 | 457 | 1.72 | 1.57 | 1.89 |
| 2025-10 | All | 10,224,671 | 467 | 1.67 | 1.52 | 1.83 |
| 2025-11 | All | 9,985,742 | 326 | 1.19 | 1.07 | 1.33 |
| 2025-12 | All | 10,365,364 | 152 | 0.54 | 0.45 | 0.63 |
| 2025 total | All | 115,936,784 | 4327 | 1.36 | 1.32 | 1.40 |
| 2025-01 | up to 12 TB | 2,780,417 | 171 | 2.24 | 1.92 | 2.61 |
| 2025-02 | up to 12 TB | 2,509,522 | 189 | 2.75 | 2.37 | 3.17 |
| 2025-03 | up to 12 TB | 2,729,642 | 192 | 2.57 | 2.22 | 2.96 |
| 2025-04 | up to 12 TB | 2,559,333 | 188 | 2.68 | 2.31 | 3.09 |
| 2025-05 | up to 12 TB | 2,615,651 | 165 | 2.30 | 1.96 | 2.68 |
| 2025-06 | up to 12 TB | 2,553,349 | 163 | 2.33 | 1.99 | 2.72 |
| 2025-07 | up to 12 TB | 2,636,391 | 151 | 2.09 | 1.77 | 2.45 |
| 2025-08 | up to 12 TB | 2,634,350 | 134 | 1.86 | 1.56 | 2.20 |
| 2025-09 | up to 12 TB | 2,543,529 | 183 | 2.63 | 2.26 | 3.04 |
| 2025-10 | up to 12 TB | 2,624,914 | 214 | 2.98 | 2.59 | 3.40 |
| 2025-11 | up to 12 TB | 2,533,582 | 159 | 2.29 | 1.95 | 2.68 |
| 2025-12 | up to 12 TB | 2,607,874 | 81 | 1.13 | 0.90 | 1.41 |
| 2025 total | up to 12 TB | 31,328,554 | 1990 | 2.32 | 2.22 | 2.42 |
| 2025-01 | 14 to 16 TB | 5,397,405 | 172 | 1.16 | 1.00 | 1.35 |
| 2025-02 | 14 to 16 TB | 4,877,114 | 115 | 0.86 | 0.71 | 1.03 |
| 2025-03 | 14 to 16 TB | 5,401,965 | 153 | 1.03 | 0.88 | 1.21 |
| 2025-04 | 14 to 16 TB | 5,229,968 | 163 | 1.14 | 0.97 | 1.33 |
| 2025-05 | 14 to 16 TB | 5,371,801 | 142 | 0.96 | 0.81 | 1.14 |
| 2025-06 | 14 to 16 TB | 5,233,321 | 146 | 1.02 | 0.86 | 1.20 |
| 2025-07 | 14 to 16 TB | 5,409,127 | 199 | 1.34 | 1.16 | 1.54 |
| 2025-08 | 14 to 16 TB | 5,411,047 | 236 | 1.59 | 1.40 | 1.81 |
| 2025-09 | 14 to 16 TB | 5,241,128 | 234 | 1.63 | 1.43 | 1.85 |
| 2025-10 | 14 to 16 TB | 5,419,454 | 190 | 1.28 | 1.10 | 1.48 |
| 2025-11 | 14 to 16 TB | 5,245,940 | 129 | 0.90 | 0.75 | 1.07 |
| 2025-12 | 14 to 16 TB | 5,419,078 | 46 | 0.31 | 0.23 | 0.41 |
| 2025 total | 14 to 16 TB | 63,657,348 | 1925 | 1.10 | 1.05 | 1.15 |
| 2025-01 | 20 TB and above | 1,154,815 | 34 | 1.07 | 0.74 | 1.50 |
| 2025-02 | 20 TB and above | 1,163,461 | 18 | 0.56 | 0.33 | 0.89 |
| 2025-03 | 20 TB and above | 1,421,338 | 23 | 0.59 | 0.37 | 0.89 |
| 2025-04 | 20 TB and above | 1,519,928 | 31 | 0.74 | 0.51 | 1.06 |
| 2025-05 | 20 TB and above | 1,650,833 | 31 | 0.69 | 0.47 | 0.97 |
| 2025-06 | 20 TB and above | 1,712,747 | 32 | 0.68 | 0.47 | 0.96 |
| 2025-07 | 20 TB and above | 1,823,783 | 29 | 0.58 | 0.39 | 0.83 |
| 2025-08 | 20 TB and above | 1,875,026 | 48 | 0.93 | 0.69 | 1.24 |
| 2025-09 | 20 TB and above | 1,904,016 | 40 | 0.77 | 0.55 | 1.04 |
| 2025-10 | 20 TB and above | 2,180,303 | 63 | 1.05 | 0.81 | 1.35 |
| 2025-11 | 20 TB and above | 2,206,220 | 38 | 0.63 | 0.44 | 0.86 |
| 2025-12 | 20 TB and above | 2,338,412 | 25 | 0.39 | 0.25 | 0.58 |
| 2025 total | 20 TB and above | 20,950,882 | 412 | 0.72 | 0.65 | 0.79 |
Columns
- month
- Calendar month 2025-01 to 2025-12, or "2025 total" for the sum of the twelve months.
- size_class
- All hard drives of 3 TB or more, or a nominal capacity class: up to 12 TB, 14 to 16 TB, 20 TB and above (round(capacity_bytes / 1e12)).
- drive_days
- Daily rows (drive days) of the class in the month. This is the exposure.
- failures
- Rows with failure = 1 in the month.
- afr_percent
- failures / drive_days * 365 * 100, two decimals. Computed here, with 365 days in every month.
- afr_low95
- Lower bound of the exact two-sided 95% Poisson (Garwood) interval, in percent.
- afr_high95
- Upper bound of the same interval, in percent.
License
Derivative table computed from the Backblaze Drive Stats daily files for 2025. Cite Backblaze if you use it. You are solely responsible for how you use it. Backblaze's dataset page allows sale of derivative works and forbids selling the Drive Stats data itself. This CSV is a 52-row aggregate, not the daily SMART archive, and that archive is not for sale.
Backblaze Drive Stats use terms · Hard Drive Test Data page
Sources
- Backblaze Hard Drive Test Data, data_Q1_2025.zip (daily CSV files)
- Backblaze Hard Drive Test Data, data_Q2_2025.zip (daily CSV files)
- Backblaze Hard Drive Test Data, data_Q3_2025.zip (daily CSV files)
- Backblaze Hard Drive Test Data, data_Q4_2025.zip (daily CSV files)
- Backblaze Hard Drive Test Data page and use terms
- Backblaze Drive Stats for 2025 (published annual table: 115,638,676 drive days, 4,317 failures, 1.36%)
- Garwood, F. (1936). Fiducial limits for the Poisson distribution. Biometrika 28(3-4), 437-442