Dataset · Q1 and Q2 2026 · vendor claim
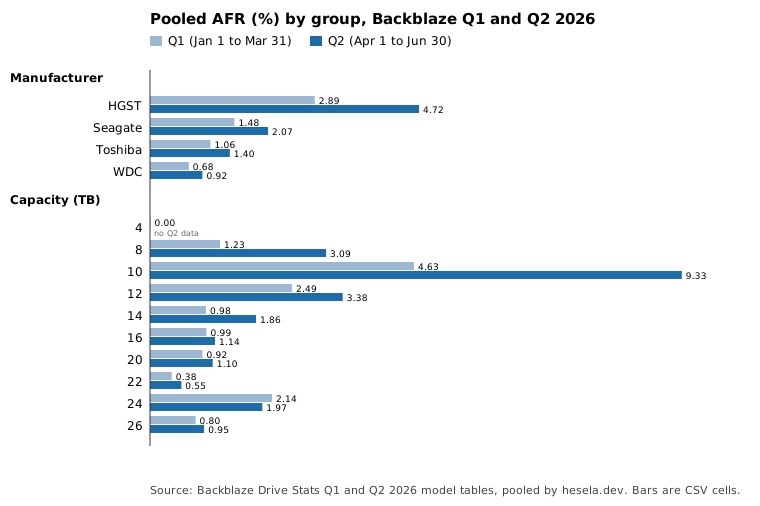
Backblaze pooled AFR by manufacturer and capacity, Q1 versus Q2 2026
Pooled annualized failure rates for Backblaze's published Q1 2026 (January 1 to March 31) and Q2 2026 (April 1 to June 30) model tables, grouped by manufacturer (4 groups) and nominal capacity (10 groups). Pooled over 33 model rows: 30,203,180 drive days and 1,030 failures in Q1, 31,553,350 drive days and 1,498 failures in Q2. Pooled AFR rose in all four manufacturer groups and in 8 of 9 capacity groups present in both quarters. Vendor claim data from Backblaze's own fleet; the grouping and pooling are computed here.
Download CSV14 rows · 12 columns · CSVPopulation and method
Population: hard drives in Backblaze’s own data centers that met the report inclusion rule, in the Q1 2026 table (January 1 to March 31, 2026, 33 model rows) and the Q2 2026 table (April 1 to June 30, 2026, 31 model rows). Each row of this file adds up the published model rows of one group. Drive days and failures are sums of printed cells. AFR is recomputed as failures ÷ drive days × 365 × 100 and rounded to two decimals. It is a pooled rate, so large models weigh more than small ones. Backblaze does not print these group rates.
Sample size: both groupings sum to 30,203,180 drive days and 1,030 failures in Q1, and 31,553,350 drive days and 1,498 failures in Q2, equal to the totals of the model-level file (1.24% and 1.73% fleet AFR).
Chart
Counted here
- HGST has the highest pooled AFR in both quarters (2.89% then 4.72%) over 2,287,586 drive days in Q2. In the model table one HGST model, HUH721212ALN604, has 180 of the group’s 296 Q2 failures.
- WDC has the lowest pooled AFR in both quarters (0.68% then 0.92%).
- The 10 TB group is a single model (Seagate ST10000NM0086) with 22 Q2 failures, which gives the highest capacity-group rate in both quarters.
Limits
- One operator’s fleet, not an industry sample. Rates are vendor claims, and the group rates are computed here from them.
- Manufacturer and capacity are confounded with model, age, and workload. Backblaze buys different models in different years, so a group rate is not a property of the manufacturer or of the capacity. Association only.
- Several capacity groups hold one model (4, 10, 20, 22, 26 TB), so they are single-model rates with small failure counts. No confidence intervals are printed or computed.
- The 4 TB group has no Q2 row because its one model left the Q2 table; that is not a claim that the drives were removed. Counts are quarter-end snapshots, so drive counts are not comparable across quarters one for one.
- Q1 drive counts in the model rows sum to 346,596 while the Q1 report text says 341,263; see the model-level page. Drive days and failures match the totals row.
Group table
| Group type | Group | Q1 models | Q1 drives | Q1 drive days | Q1 failures | Q1 AFR (%) | Q2 models | Q2 drives | Q2 drive days | Q2 failures | Q2 AFR (%) |
|---|---|---|---|---|---|---|---|---|---|---|---|
| manufacturer | HGST | 5 | 26,877 | 2,391,155 | 189 | 2.89 | 3 | 25,489 | 2,287,586 | 296 | 4.72 |
| manufacturer | Seagate | 15 | 114,438 | 10,022,300 | 406 | 1.48 | 15 | 112,567 | 10,081,663 | 573 | 2.07 |
| manufacturer | Toshiba | 8 | 117,604 | 10,167,155 | 294 | 1.06 | 8 | 125,050 | 11,090,829 | 424 | 1.40 |
| manufacturer | WDC | 5 | 87,677 | 7,622,570 | 141 | 0.68 | 5 | 91,309 | 8,093,272 | 205 | 0.92 |
| capacity_tb | 4 | 1 | 186 | 15,858 | 0 | 0.00 | |||||
| capacity_tb | 8 | 4 | 23,415 | 1,924,565 | 65 | 1.23 | 3 | 20,254 | 1,762,250 | 149 | 3.09 |
| capacity_tb | 10 | 1 | 981 | 86,667 | 11 | 4.63 | 1 | 965 | 86,092 | 22 | 9.33 |
| capacity_tb | 12 | 7 | 59,601 | 5,322,755 | 363 | 2.49 | 7 | 59,238 | 5,337,741 | 495 | 3.38 |
| capacity_tb | 14 | 6 | 59,102 | 5,302,250 | 143 | 0.98 | 6 | 59,025 | 5,344,561 | 272 | 1.86 |
| capacity_tb | 16 | 9 | 116,810 | 10,394,932 | 283 | 0.99 | 9 | 117,535 | 10,609,987 | 330 | 1.14 |
| capacity_tb | 20 | 1 | 20,451 | 1,665,263 | 42 | 0.92 | 1 | 25,270 | 2,117,524 | 64 | 1.10 |
| capacity_tb | 22 | 1 | 45,638 | 3,992,942 | 42 | 0.38 | 1 | 45,665 | 4,146,339 | 63 | 0.55 |
| capacity_tb | 24 | 2 | 16,808 | 1,315,477 | 77 | 2.14 | 2 | 19,251 | 1,686,490 | 91 | 1.97 |
| capacity_tb | 26 | 1 | 3,604 | 182,471 | 4 | 0.80 | 1 | 7,212 | 462,366 | 12 | 0.95 |
Columns
- group_type
- Grouping used: manufacturer or capacity_tb.
- group
- Manufacturer label as published (HGST, Seagate, Toshiba, WDC) or nominal capacity in terabytes.
- q1_models
- Number of model rows in the group in the Q1 2026 (January 1 to March 31) table. Empty if the group has no rows that quarter.
- q1_drive_count
- Sum of the published quarter-end drive counts of those models, Q1 2026 (January 1 to March 31).
- q1_drive_days
- Sum of published drive days, Q1 2026 (January 1 to March 31).
- q1_failures
- Sum of published failures, Q1 2026 (January 1 to March 31).
- q1_afr_percent
- Pooled AFR in percent, computed as failures / drive days * 365 * 100 and rounded to two decimals, Q1 2026 (January 1 to March 31). Not a published figure.
- q2_models
- Number of model rows in the group in the Q2 2026 (April 1 to June 30) table. Empty if the group has no rows that quarter.
- q2_drive_count
- Sum of the published quarter-end drive counts of those models, Q2 2026 (April 1 to June 30).
- q2_drive_days
- Sum of published drive days, Q2 2026 (April 1 to June 30).
- q2_failures
- Sum of published failures, Q2 2026 (April 1 to June 30).
- q2_afr_percent
- Pooled AFR in percent, computed as failures / drive days * 365 * 100 and rounded to two decimals, Q2 2026 (April 1 to June 30). Not a published figure.
License
Derivative table transcribed from Backblaze Drive Stats reports for Q1 2026 and Q2 2026. Cite Backblaze if you use it. You are solely responsible for how you use it. Backblaze's dataset page allows sale of derivative works and forbids selling the Drive Stats data itself. This CSV is a small derived aggregate of that comparison, not Backblaze's daily SMART archive, and that archive is not for sale.
Backblaze Drive Stats use terms · Q1 2026 report · Q2 2026 report