Dataset · Q1 and Q2 2026 · vendor claim plus computed intervals
Backblaze model AFR with 95% intervals, Q1 and Q2 2026
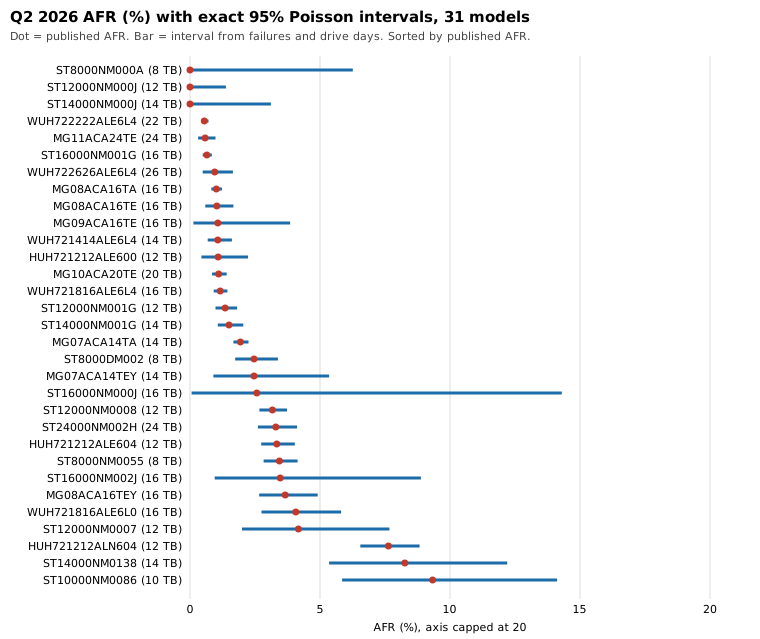
Published Q1 and Q2 2026 Backblaze AFRs for 33 hard-drive models, each with an exact 95% Poisson interval computed from the published failures and drive days. Sample: Q1 2026 (January 1 to March 31) 30,203,180 drive days and 1,030 failures; Q2 2026 (April 1 to June 30) 31,553,350 drive days and 1,498 failures. Of 31 models in both quarters, the intervals do not overlap for 4 and overlap for 27. The Poisson assumption is a modelling choice made here, not something Backblaze publishes.
Download CSV33 rows · 14 columns · CSVPopulation and method
Population: hard drives in Backblaze’s own data centers that met the report inclusion rule, in the Q1 2026 table (January 1 to March 31, 2026, 33 models) and the Q2 2026 table (April 1 to June 30, 2026, 31 models). Sample: Q1 has 30,203,180 drive days and 1,030 failures; Q2 has 31,553,350 drive days and 1,498 failures. Drive days, failures and AFR are copied from the printed tables.
The interval columns are computed here. For f failures the exact two-sided 95% Poisson interval (Garwood) is taken on the failure count and scaled by 365 × 100 ÷ drive days. This treats failures as a Poisson process over drive days with a constant rate per model and quarter. Backblaze does not publish intervals and does not state that assumption. The overlap column is “yes” when the Q1 and Q2 intervals share any value. Overlap is a cautious screen, not a hypothesis test.
Chart
Counted here
- 31 models are in both quarters. For 27 the 95% intervals overlap, for 4 they do not: HUH721212ALN604, ST8000NM0055, MG07ACA14TA, WUH721414ALE6L4. In all 4the Q2 rate is the higher one.
- 8 of 31 Q2 models had fewer than 10 failures. Their intervals are wide. The widest is ST16000NM000J at 0.06% to 14.30% around a published 2.57%.
- A model with zero failures still has an upper bound above zero: 3.69 failures scaled to its drive days at 95%. A published AFR of 0 does not mean the true rate is zero.
Limits
- One operator’s fleet, not an industry sample. The AFRs are vendor claims.
- The Poisson model ignores drive age, batch effects, and failures that cluster in time, so real uncertainty is probably larger than shown. Association only.
- 31 overlap checks were made without a multiple-comparison correction. A non-overlap here is a flag to look, not a finding about cause.
- Drive days enter as published. Models that grew or shrank during the quarter are weighted by their drive days, which is what the AFR already does.
Model table
| MFG | Model | TB | Q1 drive days | Q1 fail | Q1 AFR | Q1 low | Q1 high | Q2 drive days | Q2 fail | Q2 AFR | Q2 low | Q2 high | Overlap |
|---|---|---|---|---|---|---|---|---|---|---|---|---|---|
| HGST | HMS5C4040BLE640 | 4 | 15,858 | 0 | 0 | 0.00 | 8.49 | ||||||
| HGST | HUH728080ALE600 | 8 | 86,921 | 0 | 0 | 0.00 | 1.55 | ||||||
| HGST | HUH721212ALE600 | 12 | 234,350 | 8 | 1.25 | 0.54 | 2.46 | 236,107 | 7 | 1.08 | 0.44 | 2.23 | yes |
| HGST | HUH721212ALE604 | 12 | 1,183,774 | 86 | 2.65 | 2.12 | 3.27 | 1,190,182 | 109 | 3.34 | 2.74 | 4.03 | yes |
| HGST | HUH721212ALN604 | 12 | 870,252 | 95 | 3.98 | 3.22 | 4.87 | 861,297 | 180 | 7.63 | 6.55 | 8.83 | no |
| Seagate | ST8000DM002 | 8 | 639,473 | 25 | 1.43 | 0.92 | 2.11 | 563,210 | 38 | 2.46 | 1.74 | 3.38 | yes |
| Seagate | ST8000NM000A | 8 | 21,552 | 1 | 1.69 | 0.04 | 9.44 | 21,499 | 0 | 0 | 0.00 | 6.26 | yes |
| Seagate | ST8000NM0055 | 8 | 1,176,619 | 39 | 1.21 | 0.86 | 1.65 | 1,177,541 | 111 | 3.44 | 2.83 | 4.14 | no |
| Seagate | ST10000NM0086 | 10 | 86,667 | 11 | 4.63 | 2.31 | 8.29 | 86,092 | 22 | 9.33 | 5.85 | 14.12 | yes |
| Seagate | ST12000NM0007 | 12 | 87,389 | 11 | 4.59 | 2.29 | 8.22 | 87,496 | 10 | 4.17 | 2.00 | 7.67 | yes |
| Seagate | ST12000NM0008 | 12 | 1,664,558 | 129 | 2.83 | 2.36 | 3.36 | 1,671,057 | 145 | 3.17 | 2.67 | 3.73 | yes |
| Seagate | ST12000NM000J | 12 | 96,887 | 1 | 0.38 | 0.01 | 2.10 | 97,746 | 0 | 0 | 0.00 | 1.38 | yes |
| Seagate | ST12000NM001G | 12 | 1,185,545 | 33 | 1.02 | 0.70 | 1.43 | 1,193,856 | 44 | 1.35 | 0.98 | 1.81 | yes |
| Seagate | ST14000NM000J | 14 | 37,258 | 1 | 0.98 | 0.02 | 5.46 | 43,349 | 0 | 0 | 0.00 | 3.11 | yes |
| Seagate | ST14000NM001G | 14 | 944,400 | 21 | 0.81 | 0.50 | 1.24 | 949,396 | 39 | 1.5 | 1.07 | 2.05 | yes |
| Seagate | ST14000NM0138 | 14 | 111,709 | 15 | 4.9 | 2.74 | 8.08 | 110,410 | 25 | 8.26 | 5.35 | 12.20 | yes |
| Seagate | ST16000NM000J | 16 | 10,117 | 1 | 3.61 | 0.09 | 20.10 | 14,221 | 1 | 2.57 | 0.06 | 14.30 | yes |
| Seagate | ST16000NM001G | 16 | 3,098,105 | 44 | 0.52 | 0.38 | 0.70 | 3,162,117 | 56 | 0.65 | 0.49 | 0.84 | yes |
| Seagate | ST16000NM002J | 16 | 41,931 | 0 | 0 | 0.00 | 3.21 | 42,086 | 4 | 3.47 | 0.95 | 8.88 | yes |
| Seagate | ST24000NM002H | 24 | 820,090 | 74 | 3.29 | 2.59 | 4.13 | 861,587 | 78 | 3.3 | 2.61 | 4.12 | yes |
| Toshiba | MG07ACA14TA | 14 | 3,343,724 | 94 | 1.03 | 0.83 | 1.26 | 3,368,924 | 179 | 1.94 | 1.67 | 2.25 | no |
| Toshiba | MG07ACA14TEY | 14 | 88,602 | 5 | 2.06 | 0.67 | 4.81 | 89,164 | 6 | 2.46 | 0.90 | 5.35 | yes |
| Toshiba | MG08ACA16TA | 16 | 3,548,250 | 102 | 1.05 | 0.86 | 1.27 | 3,614,263 | 100 | 1.01 | 0.82 | 1.23 | yes |
| Toshiba | MG08ACA16TE | 16 | 553,878 | 21 | 1.38 | 0.86 | 2.12 | 568,379 | 16 | 1.03 | 0.59 | 1.67 | yes |
| Toshiba | MG08ACA16TEY | 16 | 435,063 | 26 | 2.18 | 1.42 | 3.20 | 439,243 | 44 | 3.66 | 2.66 | 4.91 | yes |
| Toshiba | MG09ACA16TE | 16 | 36,988 | 1 | 0.99 | 0.02 | 5.50 | 68,429 | 2 | 1.07 | 0.13 | 3.85 | yes |
| Toshiba | MG10ACA20TE | 20 | 1,665,263 | 42 | 0.92 | 0.66 | 1.24 | 2,117,524 | 64 | 1.1 | 0.85 | 1.41 | yes |
| Toshiba | MG11ACA24TE | 24 | 495,387 | 3 | 0.22 | 0.05 | 0.65 | 824,903 | 13 | 0.58 | 0.31 | 0.98 | yes |
| WDC | WUH721414ALE6L4 | 14 | 776,557 | 7 | 0.33 | 0.13 | 0.68 | 783,318 | 23 | 1.07 | 0.68 | 1.61 | no |
| WDC | WUH721816ALE6L0 | 16 | 267,868 | 24 | 3.27 | 2.10 | 4.87 | 268,875 | 30 | 4.07 | 2.75 | 5.81 | yes |
| WDC | WUH721816ALE6L4 | 16 | 2,402,732 | 64 | 0.97 | 0.75 | 1.24 | 2,432,374 | 77 | 1.16 | 0.91 | 1.44 | yes |
| WDC | WUH722222ALE6L4 | 22 | 3,992,942 | 42 | 0.38 | 0.28 | 0.52 | 4,146,339 | 63 | 0.55 | 0.43 | 0.71 | yes |
| WDC | WUH722626ALE6L4 | 26 | 182,471 | 4 | 0.8 | 0.22 | 2.05 | 462,366 | 12 | 0.95 | 0.49 | 1.65 | yes |
Columns
- mfg
- Manufacturer label as published by Backblaze.
- model
- Drive model identifier as published.
- size_tb
- Nominal capacity in terabytes as published.
- q1_drive_days
- Drive days in Q1 2026 (January 1 to March 31), as published. Empty if the model is not in that table.
- q1_failures
- Failures in Q1 2026 (January 1 to March 31), as published.
- q1_afr_percent
- AFR in percent for Q1 2026 (January 1 to March 31), copied as published.
- q1_afr_low95
- Lower bound of the exact two-sided 95% Poisson (Garwood) interval for the AFR, in percent, computed here from failures and drive days, Q1 2026 (January 1 to March 31).
- q1_afr_high95
- Upper bound of the same interval, in percent, Q1 2026 (January 1 to March 31).
- q2_drive_days
- Drive days in Q2 2026 (April 1 to June 30), as published. Empty if the model is not in that table.
- q2_failures
- Failures in Q2 2026 (April 1 to June 30), as published.
- q2_afr_percent
- AFR in percent for Q2 2026 (April 1 to June 30), copied as published.
- q2_afr_low95
- Lower bound of the exact two-sided 95% Poisson (Garwood) interval for the AFR, in percent, computed here from failures and drive days, Q2 2026 (April 1 to June 30).
- q2_afr_high95
- Upper bound of the same interval, in percent, Q2 2026 (April 1 to June 30).
- intervals_overlap
- yes if the Q1 and Q2 95% intervals share any value, no if they do not. Empty if the model is missing from either quarter. Computed here.
License
Derivative table transcribed from Backblaze Drive Stats reports for Q1 2026 and Q2 2026. Cite Backblaze if you use it. You are solely responsible for how you use it. Backblaze's dataset page allows sale of derivative works and forbids selling the Drive Stats data itself. This CSV is a small derived table with computed intervals, not Backblaze's daily SMART archive, and that archive is not for sale.
Backblaze Drive Stats use terms · Q1 2026 report · Q2 2026 report