Dataset · Q1 and Q2 2026 · vendor claim
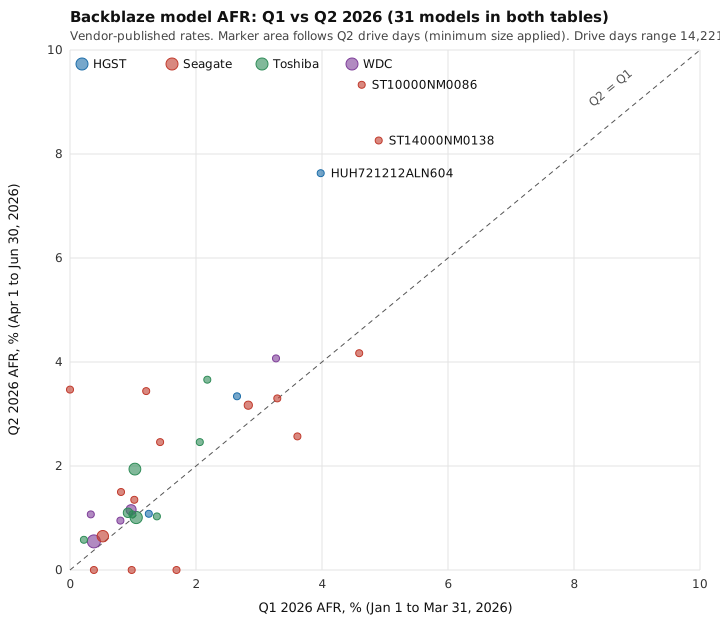
Backblaze drive model AFR, Q1 versus Q2 2026
Side-by-side published annualized failure rates for 33 hard-drive models in Backblaze's Q1 2026 (January 1 to March 31) and Q2 2026 (April 1 to June 30) Drive Stats model tables. 31 models appear in both. Fleet AFR in the published totals rows rose from 1.24% (1,030 failures, 30,203,180 drive days) to 1.73% (1,498 failures, 31,553,350 drive days). Vendor claim; Backblaze's own fleet, not an industry sample.
Download CSV33 rows · 11 columns · CSVPopulation and method
Population: hard drives in Backblaze’s own data centers that met the report inclusion rule (drive count above 100 and drive days above 10,000 as of the quarter end). Q1 covers January 1 through March 31, 2026 and lists 33 models. Q2 covers April 1 through June 30, 2026 and lists 31 models. The CSV has 33 rows, one per model that appears in either table. 31 models are in both, and 2 are only in Q1. The two Q1-only models are the HGST HMS5C4040BLE640 and HUH728080ALE600, both with zero Q1 failures. Cells are copied from the printed tables. This page recomputes every AFR as failures ÷ drive days × 365 × 100 and each matches within 0.011 percentage point.
Sample size: the Q1 rows sum to 30,203,180 drive days and 1,030 failures (1.2447%), matching the report’s totals row of 1.24%. The Q2 rows sum to 31,553,350 drive days and 1,498 failures (1.7328%), matching 1.73%. Q2 drive counts sum to the published 354,415.
Chart
Counted here
From this CSV, not from report prose. Over the 31 models in both tables, pooled AFR was 1.25% in Q1 (1,030 failures, 30,100,401 drive days) and 1.73%in Q2 (1,498 failures, 31,553,350 drive days). Failures rose by 468 in total. The five largest per-model increases in failure count account for 287 of them:
- HGST HUH721212ALN604 (12 TB): 95 to 180 failures (+85), AFR 3.98% to 7.63%.
- Toshiba MG07ACA14TA (14 TB): 94 to 179 failures (+85), AFR 1.03% to 1.94%.
- Seagate ST8000NM0055 (8 TB): 39 to 111 failures (+72), AFR 1.21% to 3.44%.
- HGST HUH721212ALE604 (12 TB): 86 to 109 failures (+23), AFR 2.65% to 3.34%.
- Toshiba MG10ACA20TE (20 TB): 42 to 64 failures (+22), AFR 0.92% to 1.1%.
Limits
- One operator’s fleet, not an industry sample. Rates are vendor claims.
- Association only. This file shows that rates differ between two quarters. It does not show why. The published tables carry no confidence interval.
- Small counts dominate the noise. 8 of 31 models had fewer than 10 Q2 failures, so a one-failure change moves their AFR by several points.
- Q1 drive counts in the rows sum to 346,596. The Q1 report text says 341,263 hard drives remained to analyze, a gap of 5,333. Q1 drive days, failures, and AFR match the totals row, and the Q1 totals row prints no drive count. This file does not decide which Q1 count is right.
- Drive count is a snapshot at quarter end. AFR uses drive days, so a model that grew during the quarter (for example the Toshiba MG10ACA20TE or the WDC WUH722626ALE6L4) has a count that is not comparable across quarters one for one.
- Vendor claim, Q1 2026 press release: drives that fail before completing their first day in production are not captured in the dataset.
- Q1 and Q2 tables are reported on the same inclusion rule but are separate reports. Q2’s own report text mislabels one paragraph as “Q1 2026”; the table title and dates are Q2.
Model table
| MFG | Model | Size (TB) | Q1 drives | Q1 drive days | Q1 failures | Q1 AFR (%) | Q2 drives | Q2 drive days | Q2 failures | Q2 AFR (%) |
|---|---|---|---|---|---|---|---|---|---|---|
| HGST | HMS5C4040BLE640 | 4 | 186 | 15,858 | 0 | 0 | ||||
| HGST | HUH728080ALE600 | 8 | 1,026 | 86,921 | 0 | 0 | ||||
| HGST | HUH721212ALE600 | 12 | 2,608 | 234,350 | 8 | 1.25 | 2,599 | 236,107 | 7 | 1.08 |
| HGST | HUH721212ALE604 | 12 | 13,277 | 1,183,774 | 86 | 2.65 | 13,196 | 1,190,182 | 109 | 3.34 |
| HGST | HUH721212ALN604 | 12 | 9,780 | 870,252 | 95 | 3.98 | 9,694 | 861,297 | 180 | 7.63 |
| Seagate | ST8000DM002 | 8 | 8,910 | 639,473 | 25 | 1.43 | 6,903 | 563,210 | 38 | 2.46 |
| Seagate | ST8000NM000A | 8 | 247 | 21,552 | 1 | 1.69 | 239 | 21,499 | 0 | 0 |
| Seagate | ST8000NM0055 | 8 | 13,232 | 1,176,619 | 39 | 1.21 | 13,112 | 1,177,541 | 111 | 3.44 |
| Seagate | ST10000NM0086 | 10 | 981 | 86,667 | 11 | 4.63 | 965 | 86,092 | 22 | 9.33 |
| Seagate | ST12000NM0007 | 12 | 983 | 87,389 | 11 | 4.59 | 972 | 87,496 | 10 | 4.17 |
| Seagate | ST12000NM0008 | 12 | 18,650 | 1,664,558 | 129 | 2.83 | 18,521 | 1,671,057 | 145 | 3.17 |
| Seagate | ST12000NM000J | 12 | 1,087 | 96,887 | 1 | 0.38 | 1,079 | 97,746 | 0 | 0 |
| Seagate | ST12000NM001G | 12 | 13,216 | 1,185,545 | 33 | 1.02 | 13,177 | 1,193,856 | 44 | 1.35 |
| Seagate | ST14000NM000J | 14 | 433 | 37,258 | 1 | 0.98 | 497 | 43,349 | 0 | 0 |
| Seagate | ST14000NM001G | 14 | 10,519 | 944,400 | 21 | 0.81 | 10,498 | 949,396 | 39 | 1.5 |
| Seagate | ST14000NM0138 | 14 | 1,251 | 111,709 | 15 | 4.9 | 1,235 | 110,410 | 25 | 8.26 |
| Seagate | ST16000NM000J | 16 | 129 | 10,117 | 1 | 3.61 | 171 | 14,221 | 1 | 2.57 |
| Seagate | ST16000NM001G | 16 | 34,729 | 3,098,105 | 44 | 0.52 | 35,100 | 3,162,117 | 56 | 0.65 |
| Seagate | ST16000NM002J | 16 | 466 | 41,931 | 0 | 0 | 467 | 42,086 | 4 | 3.47 |
| Seagate | ST24000NM002H | 24 | 9,605 | 820,090 | 74 | 3.29 | 9,631 | 861,587 | 78 | 3.3 |
| Toshiba | MG07ACA14TA | 14 | 37,263 | 3,343,724 | 94 | 1.03 | 37,171 | 3,368,924 | 179 | 1.94 |
| Toshiba | MG07ACA14TEY | 14 | 996 | 88,602 | 5 | 2.06 | 989 | 89,164 | 6 | 2.46 |
| Toshiba | MG08ACA16TA | 16 | 40,036 | 3,548,250 | 102 | 1.05 | 39,932 | 3,614,263 | 100 | 1.01 |
| Toshiba | MG08ACA16TE | 16 | 6,264 | 553,878 | 21 | 1.38 | 6,306 | 568,379 | 16 | 1.03 |
| Toshiba | MG08ACA16TEY | 16 | 4,885 | 435,063 | 26 | 2.18 | 4,857 | 439,243 | 44 | 3.66 |
| Toshiba | MG09ACA16TE | 16 | 506 | 36,988 | 1 | 0.99 | 905 | 68,429 | 2 | 1.07 |
| Toshiba | MG10ACA20TE | 20 | 20,451 | 1,665,263 | 42 | 0.92 | 25,270 | 2,117,524 | 64 | 1.1 |
| Toshiba | MG11ACA24TE | 24 | 7,203 | 495,387 | 3 | 0.22 | 9,620 | 824,903 | 13 | 0.58 |
| WDC | WUH721414ALE6L4 | 14 | 8,640 | 776,557 | 7 | 0.33 | 8,635 | 783,318 | 23 | 1.07 |
| WDC | WUH721816ALE6L0 | 16 | 2,994 | 267,868 | 24 | 3.27 | 2,970 | 268,875 | 30 | 4.07 |
| WDC | WUH721816ALE6L4 | 16 | 26,801 | 2,402,732 | 64 | 0.97 | 26,827 | 2,432,374 | 77 | 1.16 |
| WDC | WUH722222ALE6L4 | 22 | 45,638 | 3,992,942 | 42 | 0.38 | 45,665 | 4,146,339 | 63 | 0.55 |
| WDC | WUH722626ALE6L4 | 26 | 3,604 | 182,471 | 4 | 0.8 | 7,212 | 462,366 | 12 | 0.95 |
Columns
- mfg
- Manufacturer label as published by Backblaze: HGST, Seagate, Toshiba, or WDC.
- model
- Drive model identifier as published.
- size_tb
- Nominal capacity in terabytes as published.
- q1_drive_count
- Drives of this model in the Q1 2026 table. Empty if the model is not in that table.
- q1_drive_days
- Drive days observed in Q1 2026 (January 1 to March 31, 2026). Empty if not in the table.
- q1_failures
- Failures in Q1 2026 as published. Empty if not in the table.
- q1_afr_percent
- Q1 2026 AFR in percent, copied as published, not refit. Empty if not in the table.
- q2_drive_count
- Drives of this model in the Q2 2026 table. Empty if the model is not in that table.
- q2_drive_days
- Drive days observed in Q2 2026 (April 1 to June 30, 2026). Empty if not in the table.
- q2_failures
- Failures in Q2 2026 as published. Empty if not in the table.
- q2_afr_percent
- Q2 2026 AFR in percent, copied as published, not refit. Empty if not in the table.
License
Derivative table transcribed from Backblaze Drive Stats reports for Q1 2026 and Q2 2026. Cite Backblaze if you use it. You are solely responsible for how you use it. Backblaze's dataset page allows sale of derivative works and forbids selling the Drive Stats data itself. This CSV is a small derived comparison, not Backblaze's daily SMART archive, and that archive is not for sale.
Backblaze Drive Stats use terms · Q1 2026 report · Q2 2026 report