Dataset · Q4 2025 · computed from raw Backblaze files
Backblaze AFR by drive power-on age, Q4 2025
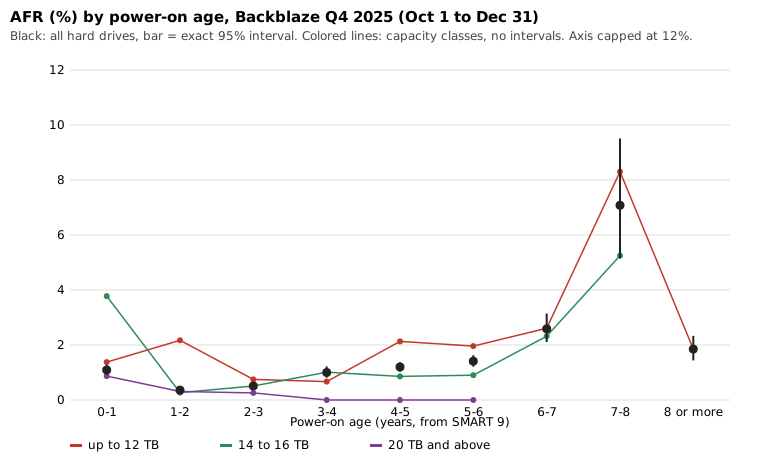
Annualized failure rate by drive power-on age, computed from Backblaze's raw daily Drive Stats files for Q4 2025 (October 1 to December 31, 2025) with the exposure counted per age bucket. Sample: hard drives of 3 TB or more with a power-on-hours value, 30,575,671 drive days and 926 failures (1.11% pooled AFR). The rate is 0.36% at 1 to under 2 years, 2.59% at 6 to under 7 and 7.08% at 7 to under 8, from 44 failures in 0.7% of drive days. Association only, one fleet and one quarter, with model mix that changes by age.
Download CSV32 rows · 8 columns · CSVPopulation and method
Population: hard drives of 3 TB or more in Backblaze’s own data centers, from the 92 daily files for October 1 to December 31, 2025, using rows whose power-on hours (SMART 9) are filled in. That is 30,575,671 drive days and 926 failures, a pooled AFR of 1.11%. Another 106 drive days and 19 failures have no power-on value and are left out.
Each drive day is placed in an age bucket by that day’s power-on hours divided by 8,766 hours per year, so a drive moves from one bucket to the next during the quarter and its exposure is split between them. A failure goes to the bucket of its failure-day row. AFR is failures ÷ drive days × 365 × 100, and the interval is the exact two-sided 95% Poisson interval on the failure count. Capacity classes use nominal terabytes: up to 12 TB, 14 to 16 TB, and 20 TB and above. The build checks that the three classes add up to the All rows.
Chart
Counted here
- For all drives the lowest bucket is 1 to under 2 years at 0.36% (0.27% to 0.48%) and the highest is 7 to under 8 years at 7.08% (5.15% to 9.51%). The first year is at 1.09% (0.92% to 1.28%).
- From 2 years up, the rate rises bucket by bucket through 6 to under 7 years (2.59%, 1,424,836 drive days), then 7.08% at 7 to under 8 years from 44 failures in 0.7% of drive days. The 8 or more bucket is 1.85%.
- Exposure is uneven: the 20 TB and above class has drive days only up to age 6 and almost all of them below 2 years, and the 14 to 16 TB class has most of its exposure at 1 to 6 years.
Limits
- Association only, one fleet, one quarter. Different ages are different drives: each bucket holds different models, batches and data-center positions, so this is not the path one drive follows as it ages. Capacity classes reduce that mixing but do not remove it.
- The older buckets may rest on few models. The 7 to under 8 bucket has 0.7% of drive days, so a handful of models could set its rate, and the file does not break it down by model.
- Backblaze retires drives, often old ones, before they wear out, so older cohorts are partly selected. The file cannot separate that from ageing.
- Power-on hours are a drive-reported counter and are used as reported, with no check for resets or vendor encodings.
- Intervals assume failures are Poisson in drive days with a constant rate inside each bucket, which ignores clustering. They are probably too narrow.
Table
| Class | Age (years) | Drive days | Share of class (%) | Failures | AFR (%) | 95% low | 95% high |
|---|---|---|---|---|---|---|---|
| All | 0 to under 1 | 4,897,416 | 16.0 | 146 | 1.09 | 0.92 | 1.28 |
| All | 1 to under 2 | 4,738,921 | 15.5 | 47 | 0.36 | 0.27 | 0.48 |
| All | 2 to under 3 | 4,066,115 | 13.3 | 57 | 0.51 | 0.39 | 0.66 |
| All | 3 to under 4 | 3,401,720 | 11.1 | 93 | 1.00 | 0.81 | 1.22 |
| All | 4 to under 5 | 5,950,078 | 19.5 | 195 | 1.20 | 1.03 | 1.38 |
| All | 5 to under 6 | 4,486,134 | 14.7 | 173 | 1.41 | 1.21 | 1.63 |
| All | 6 to under 7 | 1,424,836 | 4.7 | 101 | 2.59 | 2.11 | 3.14 |
| All | 7 to under 8 | 226,691 | 0.7 | 44 | 7.08 | 5.15 | 9.51 |
| All | 8 or more | 1,383,760 | 4.5 | 70 | 1.85 | 1.44 | 2.33 |
| up to 12 TB | 0 to under 1 | 768,814 | 9.9 | 29 | 1.38 | 0.92 | 1.98 |
| up to 12 TB | 1 to under 2 | 168,084 | 2.2 | 10 | 2.17 | 1.04 | 3.99 |
| up to 12 TB | 2 to under 3 | 145,809 | 1.9 | 3 | 0.75 | 0.15 | 2.19 |
| up to 12 TB | 3 to under 4 | 108,647 | 1.4 | 2 | 0.67 | 0.08 | 2.43 |
| up to 12 TB | 4 to under 5 | 1,576,937 | 20.3 | 92 | 2.13 | 1.72 | 2.61 |
| up to 12 TB | 5 to under 6 | 2,162,983 | 27.9 | 116 | 1.96 | 1.62 | 2.35 |
| up to 12 TB | 6 to under 7 | 1,314,920 | 16.9 | 94 | 2.61 | 2.11 | 3.19 |
| up to 12 TB | 7 to under 8 | 136,385 | 1.8 | 31 | 8.30 | 5.64 | 11.78 |
| up to 12 TB | 8 or more | 1,383,760 | 17.8 | 70 | 1.85 | 1.44 | 2.33 |
| 14 to 16 TB | 0 to under 1 | 231,653 | 1.4 | 24 | 3.78 | 2.42 | 5.63 |
| 14 to 16 TB | 1 to under 2 | 1,886,682 | 11.7 | 14 | 0.27 | 0.15 | 0.45 |
| 14 to 16 TB | 2 to under 3 | 3,781,579 | 23.5 | 53 | 0.51 | 0.38 | 0.67 |
| 14 to 16 TB | 3 to under 4 | 3,292,889 | 20.5 | 91 | 1.01 | 0.81 | 1.24 |
| 14 to 16 TB | 4 to under 5 | 4,372,891 | 27.2 | 103 | 0.86 | 0.70 | 1.04 |
| 14 to 16 TB | 5 to under 6 | 2,318,525 | 14.4 | 57 | 0.90 | 0.68 | 1.16 |
| 14 to 16 TB | 6 to under 7 | 109,916 | 0.7 | 7 | 2.32 | 0.93 | 4.79 |
| 14 to 16 TB | 7 to under 8 | 90,306 | 0.6 | 13 | 5.25 | 2.80 | 8.99 |
| 20 TB and above | 0 to under 1 | 3,896,949 | 57.9 | 93 | 0.87 | 0.70 | 1.07 |
| 20 TB and above | 1 to under 2 | 2,684,155 | 39.9 | 23 | 0.31 | 0.20 | 0.47 |
| 20 TB and above | 2 to under 3 | 138,727 | 2.1 | 1 | 0.26 | 0.01 | 1.47 |
| 20 TB and above | 3 to under 4 | 184 | 0.0 | 0 | 0.00 | 0.00 | 731.76 |
| 20 TB and above | 4 to under 5 | 250 | 0.0 | 0 | 0.00 | 0.00 | 538.58 |
| 20 TB and above | 5 to under 6 | 4,626 | 0.1 | 0 | 0.00 | 0.00 | 29.11 |
Columns
- size_class
- All hard drives of 3 TB or more, or a nominal capacity class: up to 12 TB, 14 to 16 TB, 20 TB and above.
- age_years
- Power-on age bucket in years, from smart_9_raw hours divided by 8766 on each drive day. The last bucket is 8 or more.
- drive_days
- Daily rows (drive days) of the class that fell in the bucket between 2025-10-01 and 2025-12-31. This is the exposure.
- share_of_class_drive_days_percent
- The bucket's share of the class's drive days with an age, one decimal.
- failures
- Rows with failure = 1 in the bucket.
- afr_percent
- failures / drive_days * 365 * 100, two decimals. Computed here.
- afr_low95
- Lower bound of the exact two-sided 95% Poisson (Garwood) interval, in percent. Computed here.
- afr_high95
- Upper bound of the same interval, in percent.
License
Derivative table computed from the Backblaze Drive Stats daily files for Q4 2025. Cite Backblaze if you use it. You are solely responsible for how you use it. Backblaze's dataset page allows sale of derivative works and forbids selling the Drive Stats data itself. This CSV is a 32-row aggregate, not the daily SMART archive, and that archive is not for sale.
Backblaze Drive Stats use terms · Hard Drive Test Data page