Dataset · Q4 2025 · computed from raw Backblaze files
Power-on age of failed drives versus the fleet, Backblaze Q4 2025
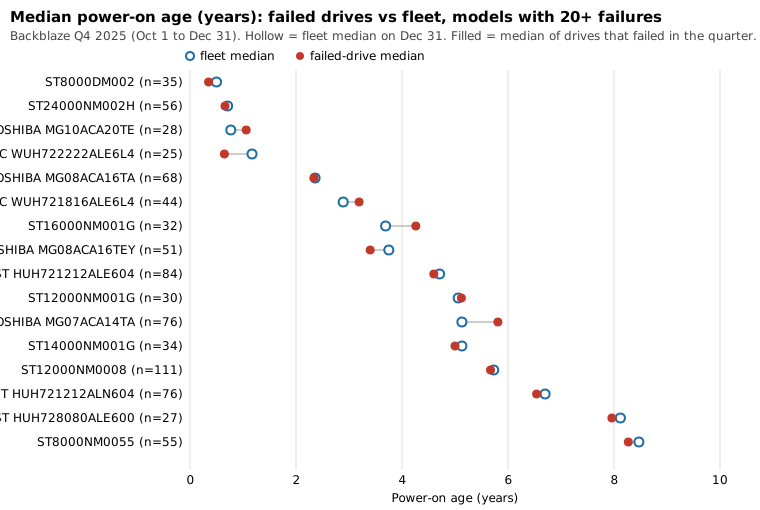
Per-model power-on age of the hard drives that failed in Backblaze's Q4 2025 (October 1 to December 31, 2025) against the age of the fleet on December 31, computed from Backblaze's raw daily Drive Stats files. Sample: 34 hard-drive models, 334,392 drives on December 31, 30,534,025 drive days, 943 failures (1.13% pooled AFR), of which 924 carry a power-on-hours value. Pooled medians are 4.65 years for failed drives and 3.38 years for the fleet, but within single models the two medians are close.
Download CSV35 rows · 9 columns · CSVPopulation and method
Population: hard drives of 3 TB or more in Backblaze’s own data centers in the 92 daily files from October 1 to December 31, 2025, limited to models with more than 100 drives on December 31 and more than 10,000 drive days in the quarter, the report’s quarterly rule. That leaves 34 models with 334,392 drives on December 31, 30,534,025 drive days and 943 failures, a pooled AFR of 1.13%. A drive day is one daily row, and a failure is a row with failure = 1.
Age is the raw value of SMART attribute 9 (power-on hours) divided by 8,766 hours per year. For failed drives it is read on the failure day, for the fleet on December 31. 924 of the 943 failures have the value filled in. All numbers are computed here from the daily files, not copied from Backblaze’s tables. As a check, three AFRs that Backblaze printed in its Q4 2025 text (HGST HUH728080ALE600 10.29%, Seagate ST10000NM0086 5.23%, Toshiba MG08ACA16TEY 4.14%) are reproduced exactly by this file, and the build fails if they stop matching.
Chart
Counted here
- Pooled over all 34 models, the median age of failed drives is 4.65 years and the fleet median is 3.38 years. The pooled medians mix models of very different ages and sizes, so the gap combines model mix with any age effect and cannot be read as either.
- Within single models the picture differs. Of the 16 models with 20 or more aged failures, the failed-drive median is above the fleet median for 5 and below it for 11. The largest gap in either direction is 0.68 years.
- The three highest AFRs among models with 1,000 or more drives are HGST HUH728080ALE600 (10.29%, fleet median 8.12 years); TOSHIBA MG08ACA16TEY (4.14%, fleet median 3.75 years); ST24000NM002H (3.51%, fleet median 0.71 years).
Limits
- One operator’s fleet, one quarter. Association only: this does not say that age causes or does not cause failure.
- A median age of failed drives close to the fleet median means failures in the quarter were spread across the model’s age range. It does not give a failure rate by age, which needs each drive’s age on every day and is not computed here.
- Models with few failures have unstable medians. The chart shows only models with 20 or more aged failures, and the table shows the rest with their counts.
- Power-on hours are a drive-reported counter. This file does not check them for resets or vendor-specific encodings, so a model with an odd value would show up here unflagged.
- Backblaze reports analysing 337,192 hard drives for Q4 2025. This file counts 334,392 under the rule above. The gap is not resolved here. Model names are used as they appear in the files, so WUH721816ALE6L4 appears twice, once with a WDC prefix, as they appear in the daily files.
Model table
| Model | TB | Drives Dec 31 | Drive days | Failures | AFR (%) | Failures with age | Fleet median age (y) | Failed median age (y) |
|---|---|---|---|---|---|---|---|---|
| WDC WUH722222ALE6L4 | 22 | 44,265 | 3,945,245 | 25 | 0.23 | 25 | 1.17 | 0.65 |
| TOSHIBA MG08ACA16TA | 16 | 39,442 | 3,670,933 | 68 | 0.68 | 68 | 2.36 | 2.34 |
| TOSHIBA MG07ACA14TA | 14 | 37,213 | 3,428,534 | 76 | 0.81 | 76 | 5.13 | 5.81 |
| ST16000NM001G | 16 | 34,305 | 3,149,031 | 35 | 0.41 | 32 | 3.69 | 4.26 |
| WDC WUH721816ALE6L4 | 16 | 26,310 | 2,421,840 | 44 | 0.66 | 44 | 2.89 | 3.19 |
| ST12000NM0008 | 12 | 18,551 | 1,715,709 | 112 | 2.38 | 111 | 5.73 | 5.67 |
| TOSHIBA MG10ACA20TE | 20 | 17,999 | 1,656,127 | 28 | 0.62 | 28 | 0.77 | 1.06 |
| ST8000NM0055 | 8 | 13,185 | 1,217,828 | 56 | 1.68 | 55 | 8.47 | 8.27 |
| ST12000NM001G | 12 | 13,147 | 1,214,910 | 31 | 0.93 | 30 | 5.06 | 5.12 |
| HGST HUH721212ALE604 | 12 | 13,095 | 1,221,499 | 85 | 2.54 | 84 | 4.71 | 4.60 |
| ST14000NM001G | 14 | 10,464 | 968,495 | 34 | 1.28 | 34 | 5.13 | 5.00 |
| HGST HUH721212ALN604 | 12 | 9,692 | 900,963 | 76 | 3.08 | 76 | 6.70 | 6.54 |
| ST8000DM002 | 8 | 8,796 | 818,034 | 38 | 1.70 | 35 | 0.50 | 0.35 |
| WDC WUH721414ALE6L4 | 14 | 8,630 | 794,489 | 14 | 0.64 | 14 | 5.06 | 4.89 |
| ST24000NM002H | 24 | 8,328 | 676,414 | 65 | 3.51 | 56 | 0.71 | 0.66 |
| TOSHIBA MG08ACA16TE | 16 | 6,210 | 568,599 | 9 | 0.58 | 9 | 4.22 | 4.03 |
| TOSHIBA MG08ACA16TEY | 16 | 4,861 | 449,560 | 51 | 4.14 | 51 | 3.75 | 3.40 |
| TOSHIBA MG11ACA24TE | 24 | 4,739 | 349,939 | 7 | 0.73 | 7 | 0.27 | 0.16 |
| WDC WUH721816ALE6L0 | 16 | 2,979 | 274,524 | 11 | 1.46 | 11 | 4.12 | 3.89 |
| HGST HUH721212ALE600 | 12 | 2,606 | 239,745 | 4 | 0.61 | 4 | 6.53 | 5.90 |
| ST14000NM0138 | 14 | 1,251 | 115,388 | 10 | 3.16 | 10 | 5.04 | 4.88 |
| WDC WUH722626ALE6L4 | 26 | 1,200 | 91,690 | 1 | 0.40 | 1 | 0.22 | 0.01 |
| ST12000NM000J | 12 | 1,059 | 96,136 | 1 | 0.38 | 1 | 1.44 | 1.96 |
| HGST HUH728080ALE600 | 8 | 1,021 | 95,800 | 27 | 10.29 | 27 | 8.12 | 7.96 |
| TOSHIBA MG07ACA14TEY | 14 | 983 | 89,854 | 6 | 2.44 | 6 | 3.39 | 1.02 |
| ST12000NM0007 | 12 | 981 | 90,539 | 9 | 3.63 | 9 | 6.28 | 6.06 |
| ST10000NM0086 | 10 | 978 | 90,651 | 13 | 5.23 | 13 | 8.28 | 8.11 |
| ST16000NM002J | 16 | 465 | 42,714 | 0 | 0.00 | 0 | 3.55 | |
| ST14000NM000J | 14 | 407 | 36,688 | 2 | 1.99 | 2 | 1.16 | 1.32 |
| TOSHIBA MG09ACA16TE | 16 | 348 | 28,207 | 2 | 2.59 | 2 | 0.46 | 0.54 |
| WUH721816ALE6L4 | 16 | 340 | 24,001 | 1 | 1.52 | 1 | 1.13 | 0.96 |
| ST8000NM000A | 8 | 245 | 22,700 | 0 | 0.00 | 0 | 2.67 | |
| HGST HMS5C4040BLE640 | 4 | 186 | 17,151 | 1 | 2.13 | 1 | 8.78 | 8.85 |
| ST16000NM000J | 16 | 111 | 10,088 | 1 | 3.62 | 1 | 1.48 | 0.19 |
| ALL 34 MODELS | 334,392 | 30,534,025 | 943 | 1.13 | 924 | 3.38 | 4.65 |
Columns
- model
- Drive model string as it appears in the daily files. The last row is the pooled row for all included models.
- size_tb
- Largest capacity_bytes seen for the model, in terabytes (10^12 bytes), rounded. Empty on the pooled row.
- drives_2025_12_31
- Rows for the model in the 2025-12-31 daily file, the quarter-end drive count.
- drive_days
- Daily rows for the model from 2025-10-01 to 2025-12-31.
- failures
- Rows with failure = 1 in that period.
- afr_percent
- failures / drive_days * 365 * 100, two decimals. Computed here from the daily files.
- failures_with_age
- Failed drives whose smart_9_raw (power-on hours) was filled in on the failure day. Always at most failures.
- fleet_median_age_years
- Median smart_9_raw on 2025-12-31 over the model's drives, divided by 8766 hours per year.
- failed_median_age_years
- Median smart_9_raw of the failed drives on their failure day, divided by 8766. Empty when no failed drive has the value.
License
Derivative table computed from the Backblaze Drive Stats daily files for Q4 2025. Cite Backblaze if you use it. You are solely responsible for how you use it. Backblaze's dataset page allows sale of derivative works and forbids selling the Drive Stats data itself. This CSV is a 35-row aggregate, not the daily SMART archive, and that archive is not for sale.
Backblaze Drive Stats use terms · Hard Drive Test Data page