Dataset · Q4 2025 · computed from raw Backblaze files
SMART 5, 187, 188, 197 and 198 in failed versus surviving drives, Backblaze Q4 2025
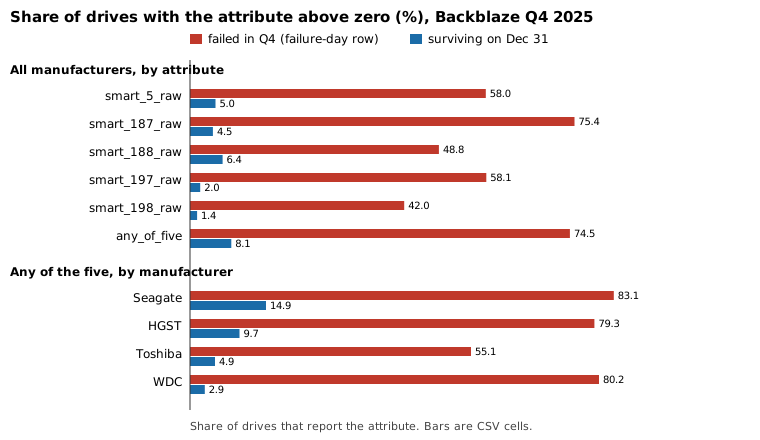
Share of drives with a non-zero raw value for five SMART attributes (5, 187, 188, 197, 198), computed from Backblaze's raw daily Drive Stats files for Q4 2025 (October 1 to December 31, 2025). Sample: 945 hard drives of 3 TB or more that failed in the quarter, read on their failure day, against 334,842 drives that survived to December 31. At least one of the five is above zero for 74.5% of failed drives that report any (690 of 926) and 8.1% of survivors. Association at the failure day, not a prediction test; one fleet, one quarter.
Download CSV24 rows · 12 columns · CSVPopulation and method
Population: hard drives of 3 TB or more in Backblaze’s own data centers, from the 92 daily files for October 1 to December 31, 2025. The failed group is 945 drives, one row each, taken on the day the drive was marked failed. The survivor group is 334,842 drives in the December 31 file with no failure flag. For each of SMART attributes 5, 187, 188, 197 and 198 the file counts the drives with a value filled in and, of those, the drives with a raw value above zero. “any_of_five” means at least one of the five is above zero. Percentages are above-zero drives ÷ drives that report the attribute. The failed-drive percentage carries a 95% Wilson interval. Rows where fewer than 20 failed drives report the attribute are left out.
Manufacturer is inferred from the model string. Not every maker reports every attribute: in practice only Seagate drives report 187 and 188 in this data (one failed WDC drive and 340 WDC survivors report 188), so the All rows for those two describe Seagate drives. The build checks that manufacturer rows add up to the All rows for the other attributes.
Chart
Counted here
- 690 of the 926 failed drives that report any of the five (74.5%, 95% interval 71.6% to 77.2%) had at least one above zero, against 27,261 of 334,839 survivors (8.1%).
- The other side matters as much: 236 failed drives that report the attributes had all of them at zero, and 19 failed drives had none of the five filled in. That is 255 of 945 failures with no non-zero signal among these five on the failure day.
- By manufacturer, the share of failed drives with any of the five above zero is Seagate 83.1% (survivors 14.9%), HGST 79.3% (survivors 9.7%), Toshiba 55.1% (survivors 4.9%), WDC 80.2% (survivors 2.9%).
- Counts per attribute differ: for all makers, 5 is above zero in 58.0% of failed drives and 5.0% of survivors; 197 in 58.1% and 2.0%; 198 in 42.0% and 1.4%.
Limits
- This compares drives on the failure day with a December 31 snapshot of drives that had not failed. It does not measure how early a warning appears, and it is not a prediction test: a prediction needs the values days or weeks before failure and a false-alarm rate over the whole fleet, which this file does not compute.
- The fleets differ. Failed drives and survivors come from different models and ages, and the pooled rows mix manufacturers that report different attributes. The manufacturer rows reduce but do not remove that. Association only.
- Raw values are vendor-defined. A raw value above zero means the counter is not zero, not that the drive is unhealthy, and the file does not use the normalised values or thresholds.
- Survivors are one day’s snapshot (334,842 drives), while failures accumulate over 92 days. The survivor percentage describes the state of drives still running on December 31 and carries no interval here because of its size.
- Manufacturer comes from model-name prefixes, and rows with fewer than 20 reporting failed drives are omitted, so the table has no WDC 188 row and no 187 or 188 rows for HGST or Toshiba.
Table
| Maker | Attribute | Failed | Failed reporting | Failed above 0 | Failed % | 95% low | 95% high | Survivors | Surv. reporting | Surv. above 0 | Surv. % |
|---|---|---|---|---|---|---|---|---|---|---|---|
| All | smart_5_raw | 945 | 926 | 537 | 58.0 | 54.8 | 61.1 | 334,842 | 334,839 | 16,794 | 5.0 |
| All | smart_187_raw | 945 | 390 | 294 | 75.4 | 70.9 | 79.4 | 334,842 | 112,540 | 5,069 | 4.5 |
| All | smart_188_raw | 945 | 391 | 191 | 48.8 | 43.9 | 53.8 | 334,842 | 112,880 | 7,199 | 6.4 |
| All | smart_197_raw | 945 | 869 | 505 | 58.1 | 54.8 | 61.4 | 334,842 | 328,995 | 6,510 | 2.0 |
| All | smart_198_raw | 945 | 926 | 389 | 42.0 | 38.9 | 45.2 | 334,842 | 334,839 | 4,521 | 1.4 |
| All | any_of_five | 945 | 926 | 690 | 74.5 | 71.6 | 77.2 | 334,842 | 334,839 | 27,261 | 8.1 |
| Seagate | smart_5_raw | 408 | 390 | 274 | 70.3 | 65.5 | 74.6 | 112,543 | 112,540 | 9,128 | 8.1 |
| Seagate | smart_187_raw | 408 | 390 | 294 | 75.4 | 70.9 | 79.4 | 112,543 | 112,540 | 5,069 | 4.5 |
| Seagate | smart_188_raw | 408 | 390 | 191 | 49.0 | 44.0 | 53.9 | 112,543 | 112,540 | 7,192 | 6.4 |
| Seagate | smart_197_raw | 408 | 390 | 186 | 47.7 | 42.8 | 52.6 | 112,543 | 112,540 | 1,786 | 1.6 |
| Seagate | smart_198_raw | 408 | 390 | 186 | 47.7 | 42.8 | 52.6 | 112,543 | 112,540 | 1,786 | 1.6 |
| Seagate | any_of_five | 408 | 390 | 324 | 83.1 | 79.0 | 86.5 | 112,543 | 112,540 | 16,799 | 14.9 |
| HGST | smart_5_raw | 194 | 193 | 118 | 61.1 | 54.1 | 67.7 | 26,725 | 26,725 | 1,524 | 5.7 |
| HGST | smart_197_raw | 194 | 193 | 151 | 78.2 | 71.9 | 83.5 | 26,725 | 26,725 | 2,169 | 8.1 |
| HGST | smart_198_raw | 194 | 193 | 138 | 71.5 | 64.8 | 77.4 | 26,725 | 26,725 | 1,831 | 6.9 |
| HGST | any_of_five | 194 | 193 | 153 | 79.3 | 73.0 | 84.4 | 26,725 | 26,725 | 2,605 | 9.7 |
| Toshiba | smart_5_raw | 247 | 247 | 94 | 38.1 | 32.2 | 44.3 | 111,850 | 111,850 | 4,116 | 3.7 |
| Toshiba | smart_197_raw | 247 | 190 | 102 | 53.7 | 46.6 | 60.6 | 111,850 | 106,006 | 1,549 | 1.5 |
| Toshiba | smart_198_raw | 247 | 247 | 56 | 22.7 | 17.9 | 28.3 | 111,850 | 111,850 | 778 | 0.7 |
| Toshiba | any_of_five | 247 | 247 | 136 | 55.1 | 48.8 | 61.1 | 111,850 | 111,850 | 5,456 | 4.9 |
| WDC | smart_5_raw | 96 | 96 | 51 | 53.1 | 43.2 | 62.8 | 83,724 | 83,724 | 2,026 | 2.4 |
| WDC | smart_197_raw | 96 | 96 | 66 | 68.8 | 58.9 | 77.1 | 83,724 | 83,724 | 1,006 | 1.2 |
| WDC | smart_198_raw | 96 | 96 | 9 | 9.4 | 5.0 | 16.9 | 83,724 | 83,724 | 126 | 0.2 |
| WDC | any_of_five | 96 | 96 | 77 | 80.2 | 71.1 | 86.9 | 83,724 | 83,724 | 2,401 | 2.9 |
Columns
- manufacturer
- All, or the manufacturer group inferred from the model string: Seagate (ST...), HGST (HGST, HUH, HMS), Toshiba, WDC (WDC, WUH, WD).
- attribute
- smart_5_raw (reallocated sectors), smart_187_raw (reported uncorrectable errors), smart_188_raw (command timeout), smart_197_raw (current pending sectors), smart_198_raw (offline uncorrectable), or any_of_five (at least one of the five above zero).
- failed_drives
- Drives that failed between 2025-10-01 and 2025-12-31, one failure-day row each, hard drives of 3 TB or more.
- failed_filled
- Failed drives whose row has the attribute filled in (not blank). For any_of_five, at least one of the five filled.
- failed_above_zero
- Failed drives with the raw value above zero.
- failed_percent
- failed_above_zero / failed_filled * 100, one decimal. Computed here.
- failed_percent_low95
- Lower bound of the 95% Wilson score interval for failed_percent. Computed here.
- failed_percent_high95
- Upper bound of the same interval.
- survivor_drives
- Drives of 3 TB or more in the 2025-12-31 file with failure = 0.
- survivor_filled
- Survivors with the attribute filled in.
- survivor_above_zero
- Survivors with the raw value above zero.
- survivor_percent
- survivor_above_zero / survivor_filled * 100, one decimal. Computed here.
License
Derivative table computed from the Backblaze Drive Stats daily files for Q4 2025. Cite Backblaze if you use it. You are solely responsible for how you use it. Backblaze's dataset page allows sale of derivative works and forbids selling the Drive Stats data itself. This CSV is a 24-row aggregate, not the daily SMART archive, and that archive is not for sale.
Backblaze Drive Stats use terms · Hard Drive Test Data page