Dataset · published specifications · no measurements
LTO generations: native and compressed capacity and throughput, LTO-1 to LTO-10
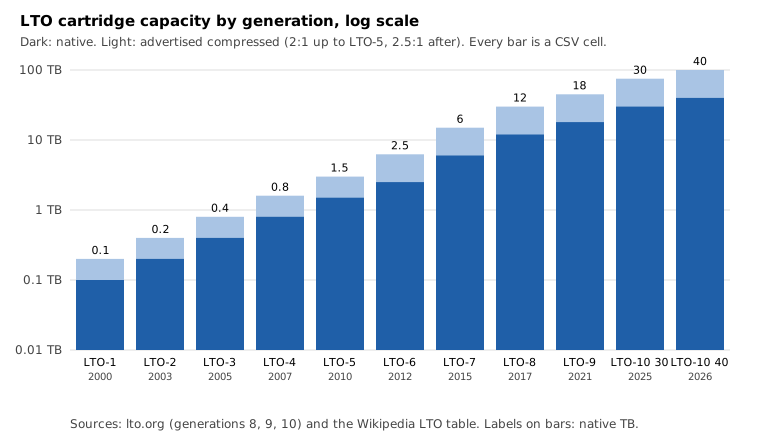
Native and advertised compressed capacity, release year and maximum native throughput of LTO Ultrium generations 1 to 10 (11 rows, with the 30 TB and 40 TB LTO-10 cartridges), taken from the LTO Program pages for generations 8, 9 and 10 and the Wikipedia generations table for the rest, plus arithmetic: the hours to write one full cartridge at the maximum native rate and the capacity step from one generation to the next. Native capacity goes from 0.1 TB in LTO-1 to 40 TB in LTO-10, and the 40 TB cartridge takes 27.78 hours to fill at 400 MB/s. Two published speed figures do not match their own arithmetic and are flagged.
Download CSV11 rows · 11 columns · CSVScope and sources
Scope: the published capacity and maximum native data rate of each LTO Ultrium generation, LTO-1 to LTO-10, with both LTO-10 cartridges. It is a table of specifications, not a benchmark of any drive. Numbers for LTO-8, LTO-9 and LTO-10 were read on the LTO Program\u2019s own pages on October 11, 2026. Release years and the numbers for LTO-1 to LTO-7 come from the generations table of the Wikipedia article on Linear Tape-Open, because the LTO Program\u2019s roadmap page does not give the earlier generations as text. The source column says which is which. Units are decimal.
The build checks that every advertised compressed capacity equals the native capacity times the compression ratio, that every fill time follows from capacity and speed, and that every capacity step is recomputed from the rows. It also checks two statements on lto.org: LTO-9 is a 50% capacity boost over LTO-8, and the LTO-10 40 TB cartridge is a 122% boost over LTO-9.
Chart
Counted here
- Native capacity goes from 0.1 TB in LTO-1 (2000) to 40 TB in the LTO-10 40 TB cartridge (2026), 400 times as much. Maximum native rate goes from 20 to 400 MB/s, 20 times as much.
- Capacity has grown faster than speed, so the time to write one full cartridge at the maximum native rate grew from 1.39 hours for LTO-1 to 12.50 hours for LTO-9 and 27.78 hours for the LTO-10 40 TB cartridge.
- The capacity step between generations is 1.50 times for LTO-9 over LTO-8 and 1.67 and 2.22 times for the two LTO-10 cartridges over LTO-9.
Two published speeds that do not match their arithmetic
- The LTO-10 page gives 400 MB/s native and 1,200 MB/s at 2.5:1 compression with a 32 Gb Fibre Channel interface. 400 × 2.5 is 1000 MB/s, not 1,200. The roadmap page says LTO-10 gives 3.6 TB per hour per drive, and 1,200 MB/s would be 4.32 TB per hour while 3.6 TB per hour is 1000 MB/s. The file keeps the 400 MB/s native figure and does not decide which of the others is right.
- The LTO-8 page says up to 750 MB/s assuming 2.5:1, which would be 300 MB/s native, while the Wikipedia table lists 360 MB/s native for LTO-8. The file uses 360 and flags the difference in the note column.
Limits
- These are maximum figures from specifications. Real throughput depends on the drive, the interface, the data and the compression achieved, and half-height drives may not reach the full-height rate.
- The compressed capacity is an advertised figure at a fixed 2:1 or 2.5:1 ratio. Data that does not compress gives native capacity.
- The LTO-1 to LTO-7 figures and the release years were read from a Wikipedia table, not from the LTO Program, and were not checked against the specifications, which are licensed documents. LTO-7 Type M cartridges are not listed.
- Fill time is arithmetic at the maximum native rate. It ignores loading, seeking and verification.
Table
| Generation | Cartridge | Year | Native (TB) | Compressed (TB) | Ratio | Max native (MB/s) | Hours to fill | Step vs previous | Source |
|---|---|---|---|---|---|---|---|---|---|
| LTO-1 | standard | 2000 | 0.1 | 0.2 | 2 | 20 | 1.39 | Wikipedia | |
| LTO-2 | standard | 2003 | 0.2 | 0.4 | 2 | 40 | 1.39 | 2.00 | Wikipedia |
| LTO-3 | standard | 2005 | 0.4 | 0.8 | 2 | 80 | 1.39 | 2.00 | Wikipedia |
| LTO-4 | standard | 2007 | 0.8 | 1.6 | 2 | 120 | 1.85 | 2.00 | Wikipedia |
| LTO-5 | standard | 2010 | 1.5 | 3 | 2 | 140 | 2.98 | 1.88 | Wikipedia |
| LTO-6 | standard | 2012 | 2.5 | 6.25 | 2.5 | 160 | 4.34 | 1.67 | Wikipedia |
| LTO-7 | standard | 2015 | 6 | 15 | 2.5 | 300 | 5.56 | 2.40 | Wikipedia |
| LTO-8 | standard | 2017 | 12 | 30 | 2.5 | 360 | 9.26 | 2.00 | lto.org for capacity; Wikipedia for speed |
| LTO-9 | standard | 2021 | 18 | 45 | 2.5 | 400 | 12.50 | 1.50 | lto.org for capacity and speed; Wikipedia for year and compressed |
| LTO-10 | 30 TB | 2025 | 30 | 75 | 2.5 | 400 | 20.83 | 1.67 | lto.org |
| LTO-10 | 40 TB | 2026 | 40 | 100 | 2.5 | 400 | 27.78 | 2.22 | lto.org |
Columns
- generation
- LTO Ultrium generation, LTO-1 to LTO-10. LTO-7 Type M (M8) is an alternate format of an LTO-7 cartridge on LTO-8 drives and is not listed.
- cartridge
- Cartridge variant: standard, or for LTO-10 the 30 TB and 40 TB cartridges.
- release_year
- Year of first availability as given in the Wikipedia generations table (LTO-10 30 TB May 2025, 40 TB January 2026).
- native_capacity_tb
- Native (uncompressed) capacity in decimal terabytes, as published.
- advertised_compressed_tb
- Advertised capacity assuming the compression ratio in the next column, as published.
- compression_ratio
- 2 for LTO-1 to LTO-5 and 2.5 from LTO-6, as published. The build checks native times ratio equals the advertised figure.
- max_native_mb_s
- Maximum native data rate in megabytes per second between drive and tape, decimal units.
- hours_to_fill_at_max_native
- native_capacity_tb * 1e6 / max_native_mb_s / 3600, hours to write one full cartridge at the maximum native rate. Computed here.
- native_capacity_vs_previous
- native_capacity_tb divided by the native capacity of the previous generation, two decimals. For both LTO-10 rows the previous generation is LTO-9. Computed here.
- source
- Where the numbers in the row come from.
- note
- Differences between the sources, without commas.
License
The capacities, ratios, years and speeds are public facts about LTO Ultrium products as published on lto.org and in the Wikipedia article on Linear Tape-Open. No page text is copied. The hours and ratio columns are arithmetic done here. LTO and Ultrium are trademarks of Hewlett Packard Enterprise, IBM and Quantum. Reuse is fine with attribution to the sources named below. This is a small derived table.
Wikipedia reuse terms · LTO roadmap page