Dataset · 2003 to 2025 · computed from published parameters
Payload ceilings of SATA, SAS and PCIe x4 links by generation
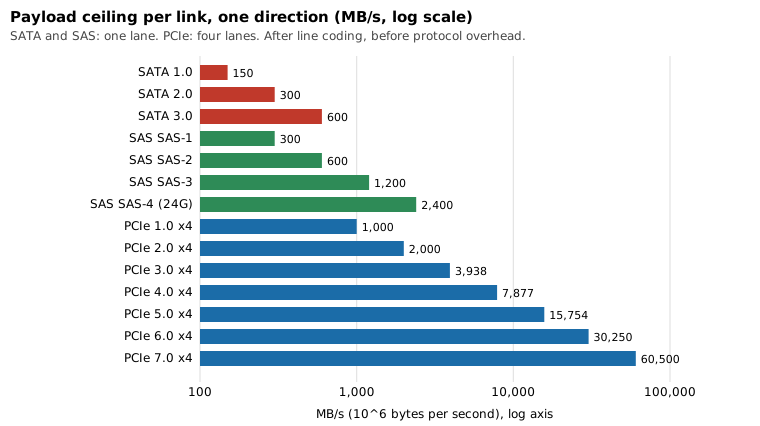
Theoretical one-direction payload ceilings for 14 storage-link generations: SATA 1.0 to 3.0, SAS-1 to SAS-4 (one lane), and PCIe 1.0 to 7.0 at four lanes. Each value is the published line rate times the line-code efficiency, and nothing is measured. SATA 3.0 gives 600 MB/s, SAS-4 gives 2,400 MB/s, PCIe 4.0 x4 gives 7,877 MB/s and PCIe 7.0 x4 gives 60,500 MB/s. Real drives and protocols stay below these ceilings.
Download CSV14 rows · 10 columns · CSVPopulation and method
Population: the 14 generations of three interface families that storage devices use, listed in the CSV. They are standards, not a sample of devices. Release years run from 2003 to 2025. For each generation the file holds the published per-lane line rate and line code, then computes the payload ceiling: line rate × payload bits ÷ coded bits. Per-lane Gbit/s are multiplied by 125 to give MB/s (10⁶ bytes), and by lane count for the link. SATA and SAS rows are one lane. PCIe rows are four lanes, the usual width of an NVMe SSD.
Nothing here is measured. The inputs are typed from public summaries of the standards (see Sources), not from the paid or member-only specification texts, so a typo in a summary would carry through. Every ceiling on this page is the CSV cell.
Chart
Counted here
- SATA 3.0 (6 Gbit/s line rate) tops out at 600 MB/s. A PCIe 3.0 x4 link has a ceiling of 3,938 MB/s,6.6 times that. PCIe 4.0 x4 is 7,877MB/s (13.1 times) and PCIe 5.0 x4 is 15,754 MB/s (26.3 times).
- One SAS-4 lane has a ceiling of 2,400 MB/s, four times SATA 3.0. Its 128b/150b code is 85.33% efficient because it carries forward error correction, compared with 80.00% for 8b/10b.
- The move from 8b/10b to 128b/130b in PCIe 3.0 raised coding efficiency from 80.00% to 98.46%. Of its ceiling gain over PCIe 2.0 at the same lane count, the line rate accounts for 1.6 times and the coding for 1.23 times.
Limits
- Ceilings only. Real throughput also pays protocol overhead (ATA FIS, SAS frames, PCIe packet headers, flow control, replays), and drives are usually slower than the link. Nothing in this file predicts a benchmark result.
- The PCIe 6.0 and 7.0 efficiency of 94.53% (242 of 256 bytes per flow control unit) already removes CRC and error-correction bytes, so it counts something different from the line-code-only efficiencies of the other rows. SAS-4 is the other row whose code includes error correction.
- One direction. SAS and PCIe links are full duplex. SATA moves data in one direction at a time, so its figure is not a sum of two directions.
- Lane counts are fixed by this file’s choice, not by the standards. SAS wide ports (several lanes) and PCIe x1, x2, x8 and x16 links scale the per-lane column linearly and are not rows.
- Spec year is the year in the cited summary. PCIe 6.0 hardware shipped years after its 2022 specification release, and PCIe 7.0 (2025) is a specification, so those rows say nothing about devices on sale.
- Rounded values: the per-lane MB/s column is rounded half up, and the link column is computed from unrounded values, so PCIe 3.0 shows 985 per lane and 3,938 for four lanes rather than 3,940.
Ceiling table
| Interface | Generation | Year | Line rate (GT/s) | Line code | Efficiency (%) | Lanes | Gbit/s per lane | MB/s per lane | MB/s link |
|---|---|---|---|---|---|---|---|---|---|
| SATA | 1.0 | 2003 | 1.5 | 8b/10b | 80.00 | 1 | 1.200 | 150 | 150 |
| SATA | 2.0 | 2004 | 3 | 8b/10b | 80.00 | 1 | 2.400 | 300 | 300 |
| SATA | 3.0 | 2009 | 6 | 8b/10b | 80.00 | 1 | 4.800 | 600 | 600 |
| SAS | SAS-1 | 2004 | 3 | 8b/10b | 80.00 | 1 | 2.400 | 300 | 300 |
| SAS | SAS-2 | 2010 | 6 | 8b/10b | 80.00 | 1 | 4.800 | 600 | 600 |
| SAS | SAS-3 | 2014 | 12 | 8b/10b | 80.00 | 1 | 9.600 | 1,200 | 1,200 |
| SAS | SAS-4 (24G) | 2019 | 22.5 | 128b/150b | 85.33 | 1 | 19.200 | 2,400 | 2,400 |
| PCIe | 1.0 | 2003 | 2.5 | 8b/10b | 80.00 | 4 | 2.000 | 250 | 1,000 |
| PCIe | 2.0 | 2007 | 5 | 8b/10b | 80.00 | 4 | 4.000 | 500 | 2,000 |
| PCIe | 3.0 | 2010 | 8 | 128b/130b | 98.46 | 4 | 7.877 | 985 | 3,938 |
| PCIe | 4.0 | 2017 | 16 | 128b/130b | 98.46 | 4 | 15.754 | 1,969 | 7,877 |
| PCIe | 5.0 | 2019 | 32 | 128b/130b | 98.46 | 4 | 31.508 | 3,938 | 15,754 |
| PCIe | 6.0 | 2022 | 64 | 242B/256B FLIT | 94.53 | 4 | 60.500 | 7,563 | 30,250 |
| PCIe | 7.0 | 2025 | 128 | 242B/256B FLIT | 94.53 | 4 | 121.000 | 15,125 | 60,500 |
Columns
- interface
- Interface family: SATA, SAS, or PCIe.
- generation
- Specification generation as named by its standards body.
- spec_year
- Year the generation was released or approved, per the cited summaries.
- line_rate_gtps
- Signalling rate per lane in gigatransfers per second (equal to Gbit/s on the coded line).
- line_code
- Line code or framing assumed for payload accounting.
- coding_efficiency_percent
- Payload bits divided by coded bits, in percent. Computed here.
- lanes
- Lanes in the link the last column refers to: 1 for SATA and SAS, 4 for PCIe (the usual NVMe SSD link).
- payload_gbps_per_lane
- Line rate times coding efficiency, Gbit/s per lane, one direction. Computed here.
- payload_mb_s_per_lane
- Same in MB/s (10^6 bytes), rounded half up.
- payload_mb_s_link
- Per-lane value times lanes, from unrounded values and then rounded half up. One direction, before protocol overhead.
License
The line rates, line codes and release years are public facts about the SATA, SAS and PCIe standards. No specification text is copied and the specifications are not reproduced. The efficiency and ceiling columns are arithmetic done on this site. Reuse is fine with attribution to the standards bodies named in the sources. This is a small derived table and not a dump of any source.
Sources
- PCI Express (comparison table of line codes, transfer rates and throughput; summarises PCI-SIG documents)
- Serial Attached SCSI (history, 8b/10b and 128b/150b encoding; summarises T10 standards)
- Serial ATA (revisions and usable rates; summarises SATA-IO releases)
- T10 technical committee, SAS standards
- PCI-SIG specifications
- SATA-IO